

Ethereum bulls are trying to keep the uptrend at a critical stage. For a solid reversal, they must try to hold the dynamic support and break above the descending resistance line.
Technical Analysis
By Grizzly
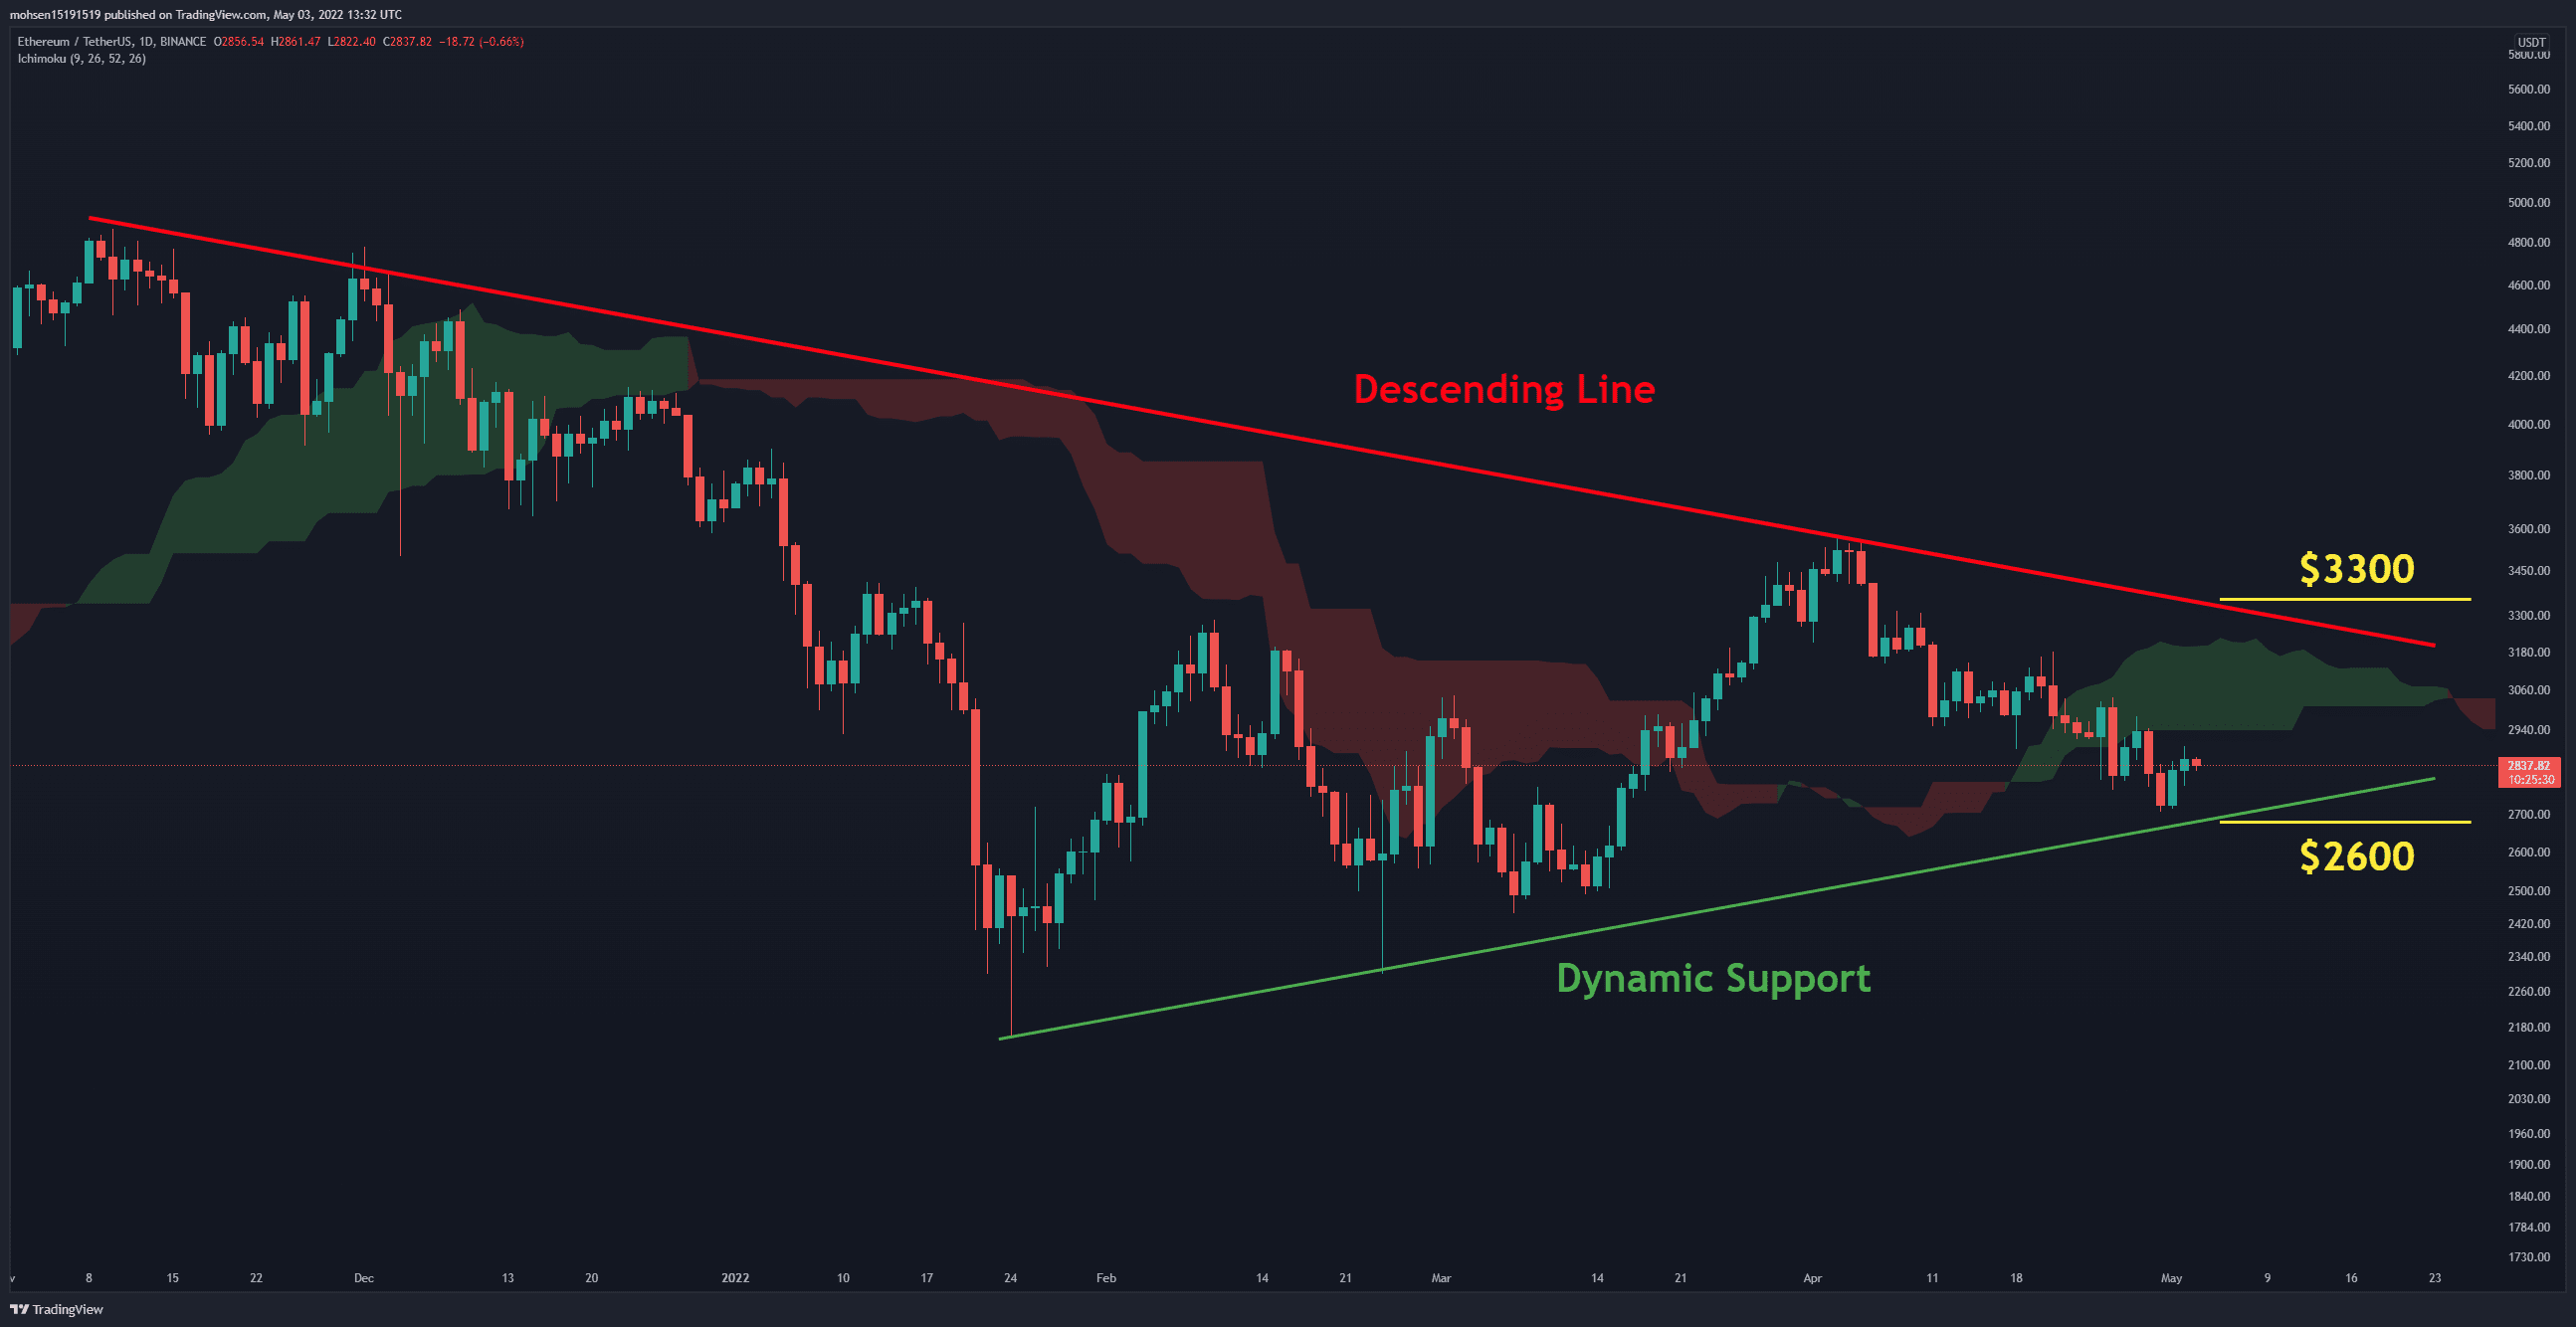
The Daily Chart
On the daily timeframe, the bears have been unable to push the price below the dynamic support (in green). This trend line is currently playing an essential role in continuing the uptrend. On the other hand, losing it can psychologically cause panic in the market.
Continuing the upward trend is associated with many challenges. The thick Ichimoku cloud is ahead of the price, accompanied by dynamic resistance and the daily MA200. The first scenario is for the bulls to return above the $3300 level. This can become a confirmation of a trend reversal.
On the other hand, if the bears continue to control the market, breaking below $2600 can damage hopes of continuing the bull market. At the time, it appears that bears have the upper hand.
Support Key Levels: $2800 & $2600 & $2300
Resistance Key Levels: $3000 & $3300
Moving Averages:
MA20: $2942
MA50: $3065
MA100: $2909
MA200: $3446
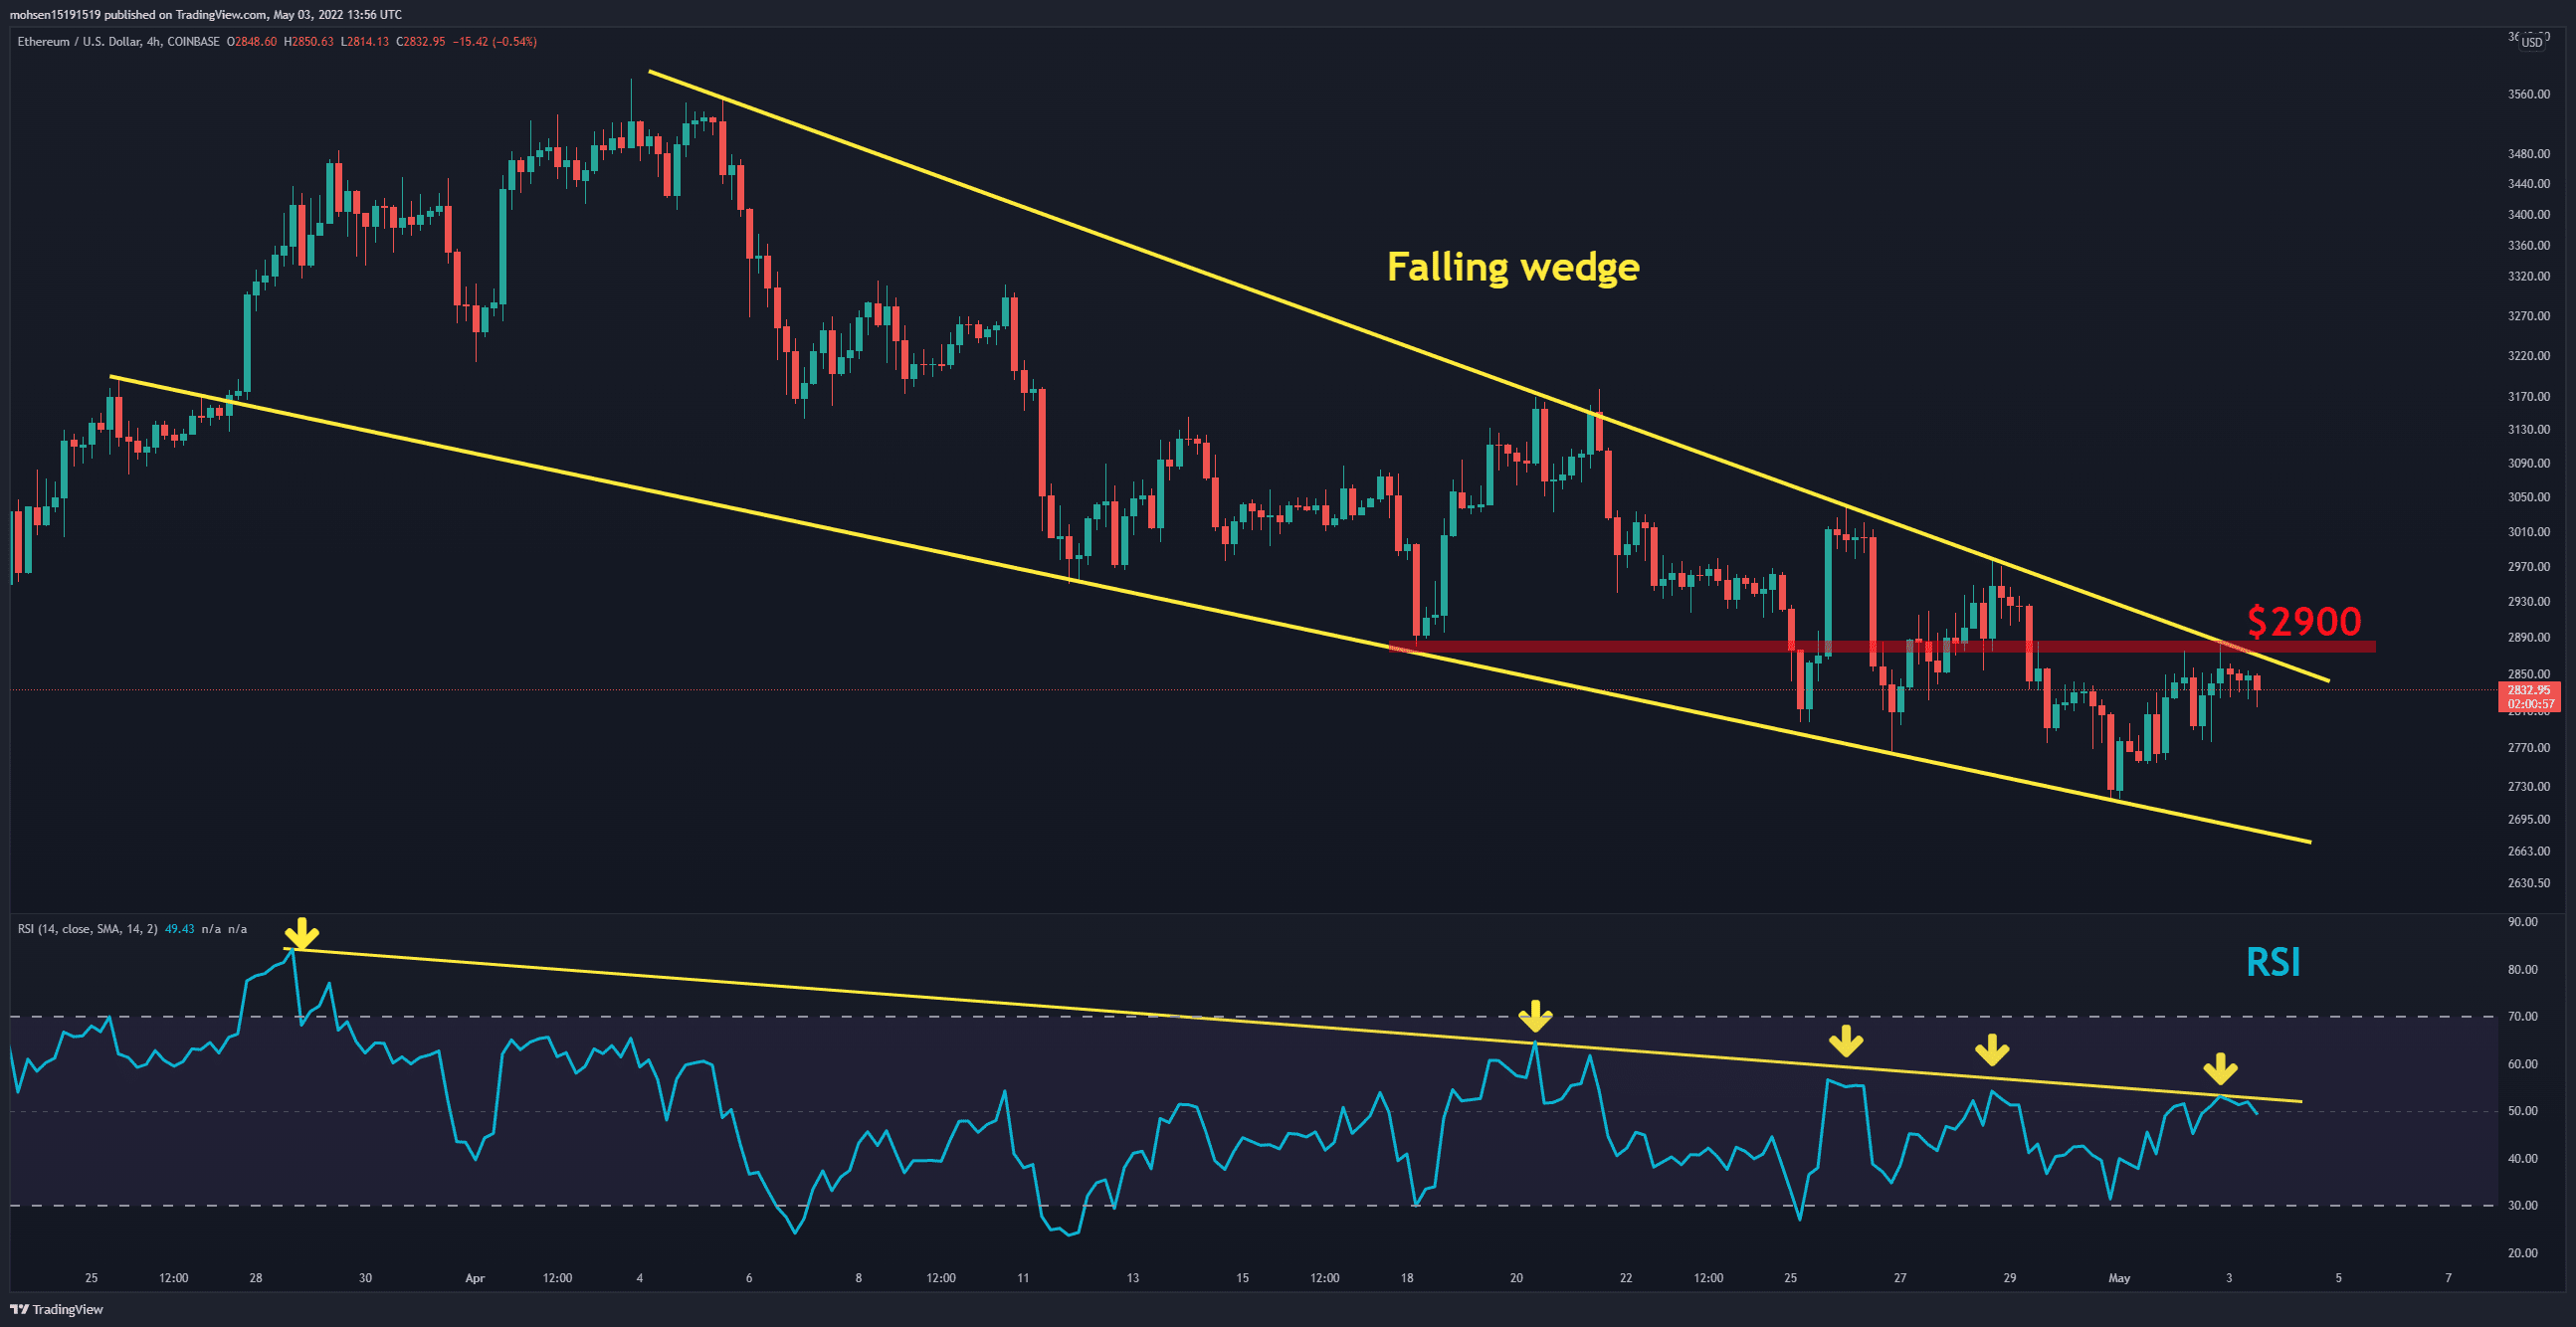
The 4-Hour Chart
ETH is descending into a falling wedge (in yellow). This pattern is classically considered bullish. Horizontal resistance at $2,900 is regarded as the key level in this timeframe. If the price fails to break this resistance, the falling wedge bottom is expected to act as a support at $2680. The RSI is also struggling with the descending line and fluctuating on the bearish and bullish zone border.
On-chain- analysis
Mean Transfer Volume to/from Exchanges
Definition: The mean size of a transaction to/from exchange addresses. Only successful transfers are counted.
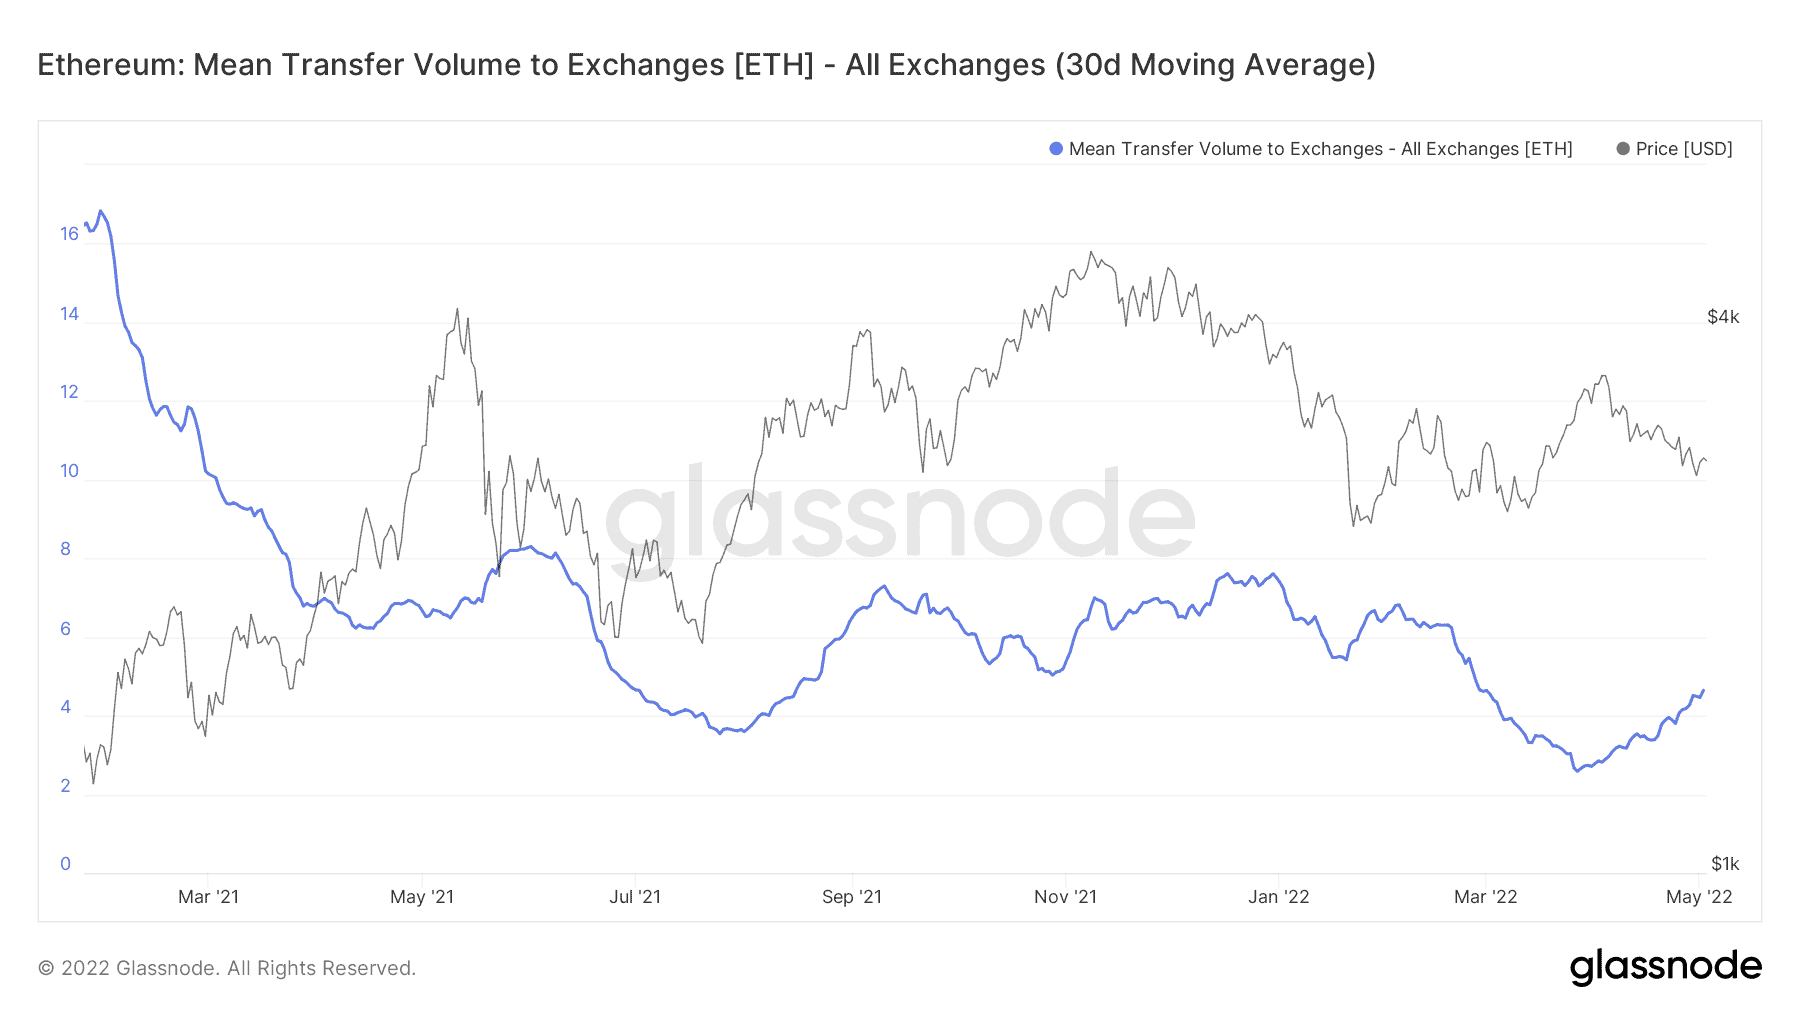
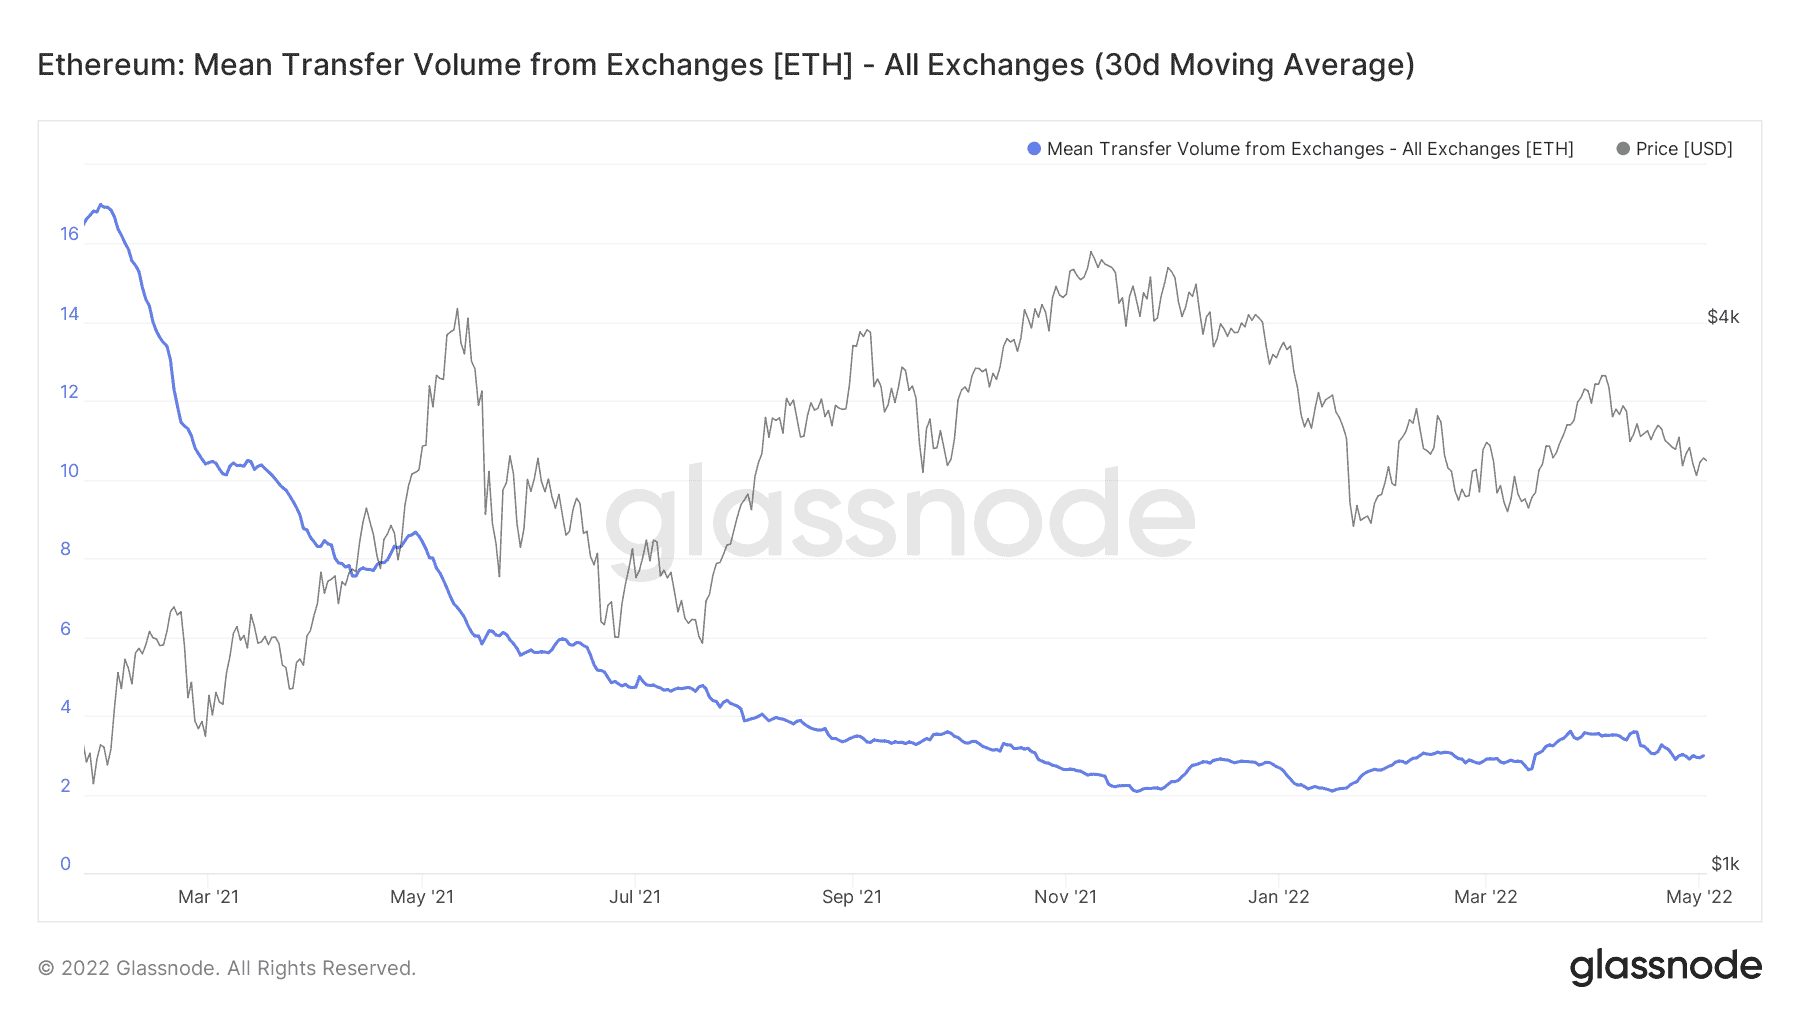
The high values in the inflow metric often present a bearish signal and indicate that, at present, investors prefer to send their coins to the exchange (specifically the larger entities). In contrast, the outflow from the exchange sends a positive signal. Currently, the mean value of transactions to exchanges is rising while the mean value of the transaction withdrawing from exchanges is staying flat. This divergence is a bearish signal from the supply/demand perspective in the market. Therefore, the probability of downward price action in short term is higher than usual.