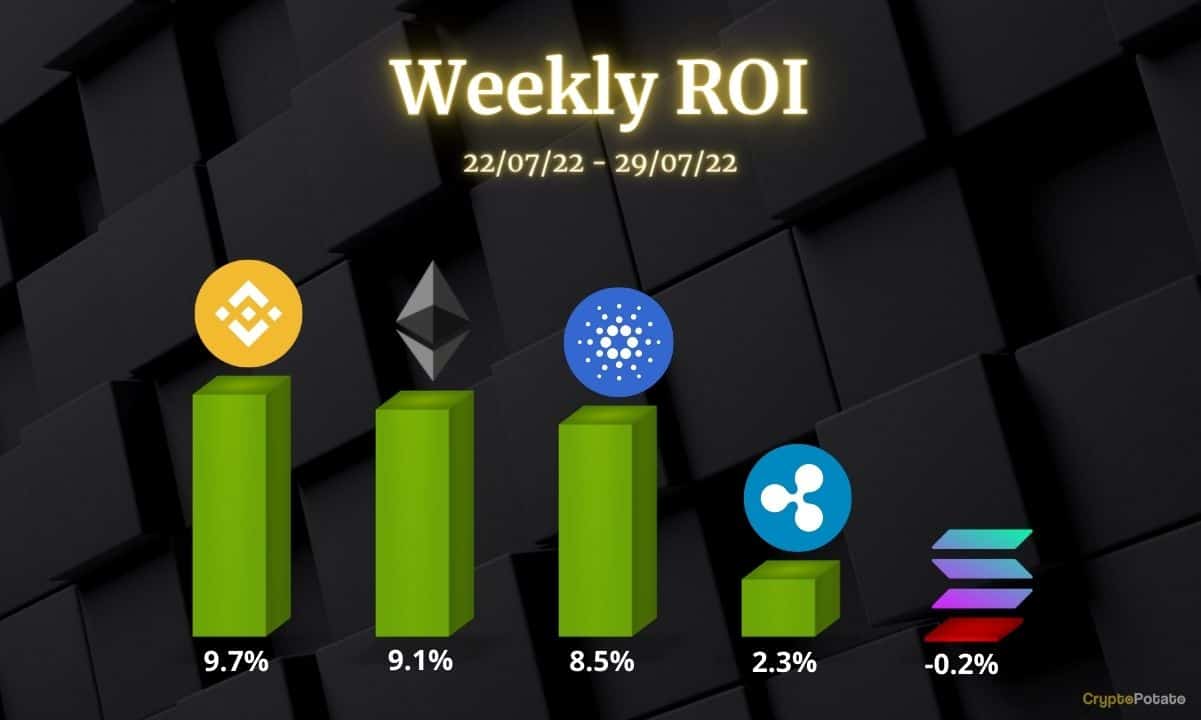
This week, we take a closer look at Ethereum, Ripple, Cardano, Binance Coin, and Solana.
Ethereum (ETH)
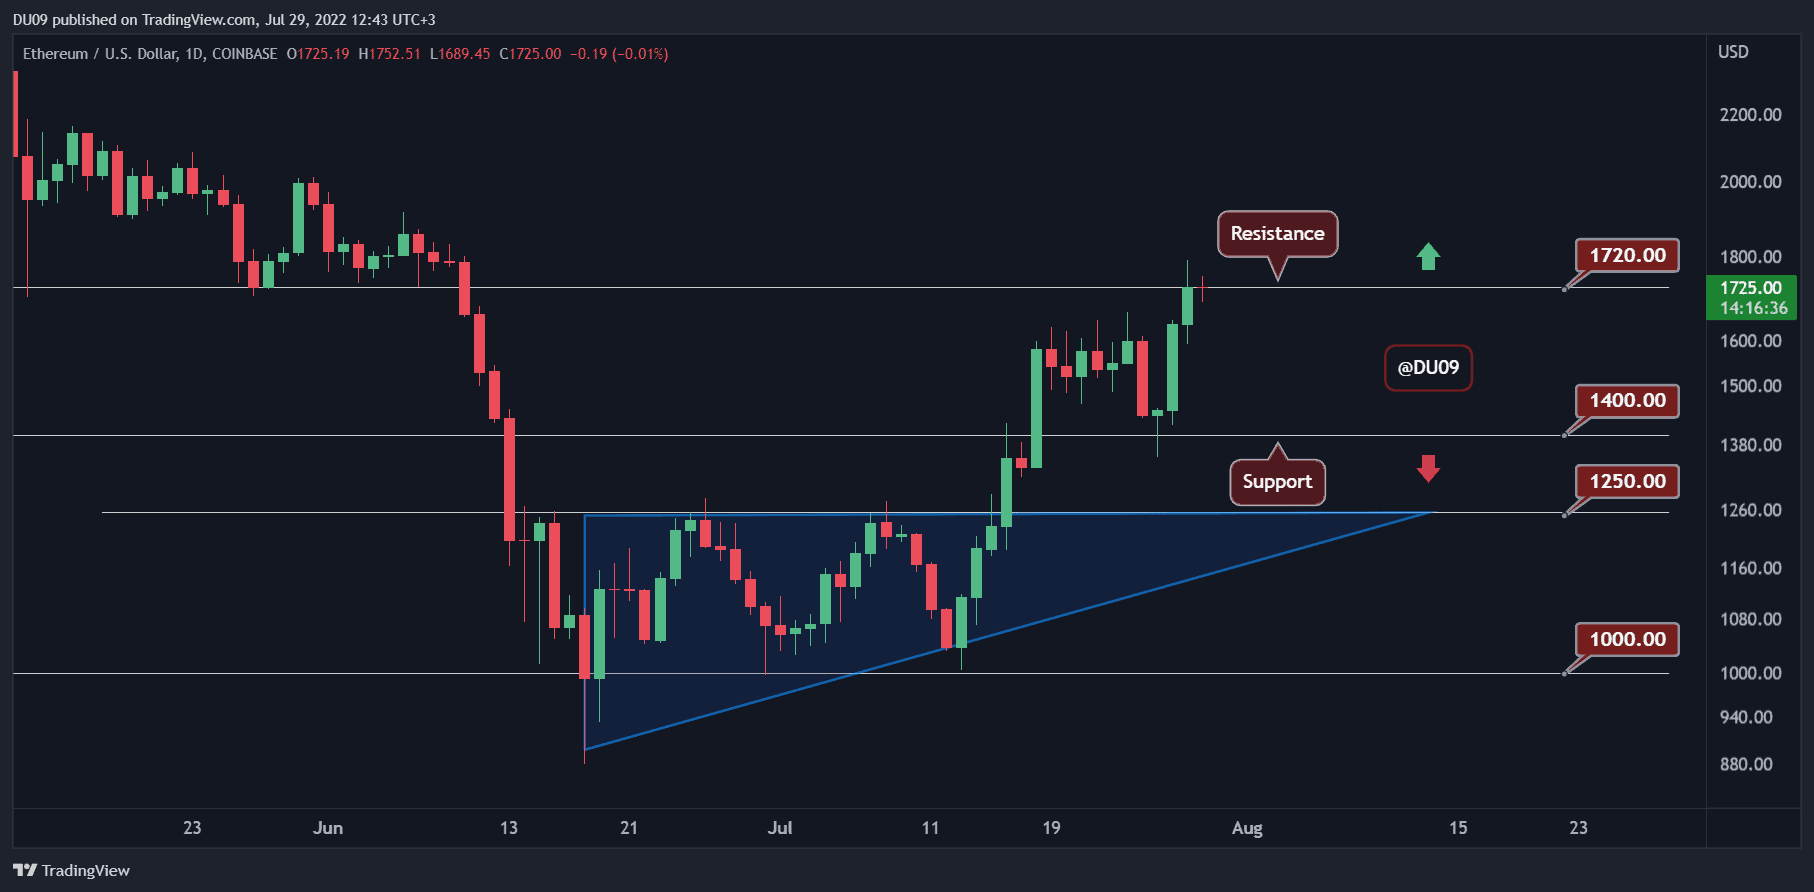
With the price just around $1,700, Ethereum has reached a key resistance after a 9.1% rally in the past seven days. Should buyers manage to push ETH above this key level, then it will have free reign until $2,000. The cryptocurrency has formed a clear uptrend with higher highs and higher lows in the past few weeks, and the bias is bullish.
ETH has been one of the strongest performers in the market since it bottomed at $880 (Binance) on Jun 18th. Since then, the price has doubled with a current local high at $1,793. This is an impressive achievement in less than two months!
The key support is found at $1,400, but if bulls manage to turn the current resistance into support, then a significant buying volume across the board could be in play. It is still uncertain if this will be the case at the time of this post therefore, a possible pullback at the key resistance level of $1,720 before another push higher from buyers is still possible.
Ripple (XRP)
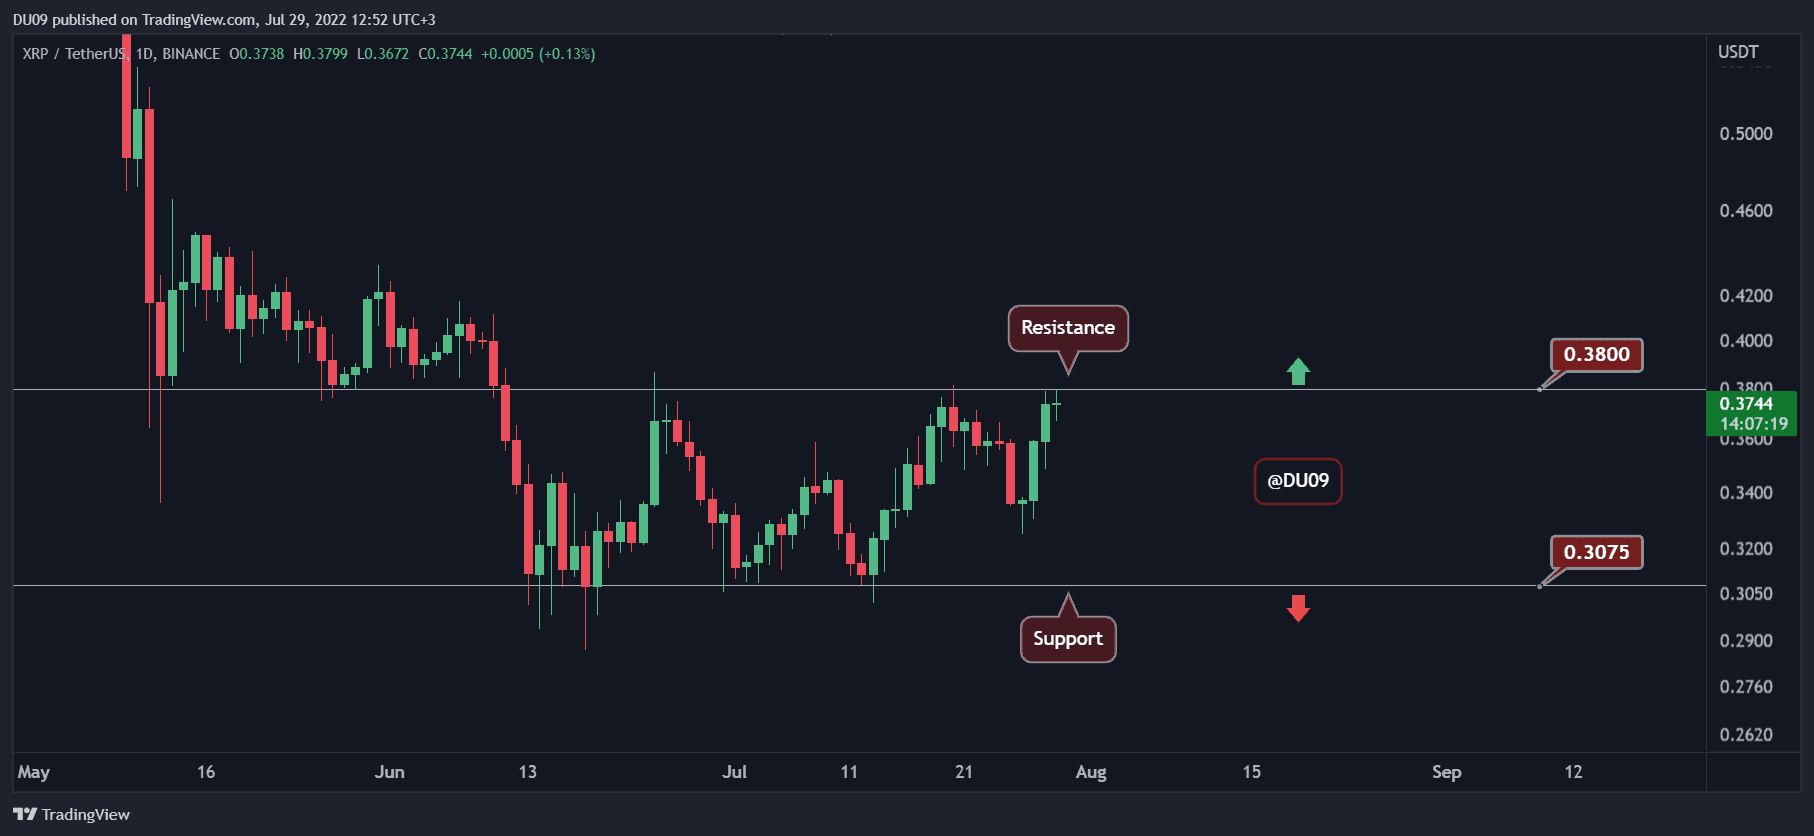
In July, XRP formed an uptrend which has slowly taken the price higher and higher after each pullback. Now, this cryptocurrency is just below the key resistance at $0.38 after a 2% increase in the past seven days. This is the second time the price arrives at this level after being rejected just over a week ago.
Ripple found good support above $0.30 and managed to get back to the key resistance. The question is if the bulls can break above. A clean breakout could take the price towards $0.50, which would bring back much-needed attention to XRP.
Looking ahead, the cryptocurrency could attempt to rally higher, but the market is at a crucial junction now. A pullback in the market leaders like BTC and ETH will likely not allow XRP to rally at this time. Nevertheless, the indicators remain bullish and the outlook is positive.
Cardano (ADA)
Despite a flat trend since May, ADA is giving some clear signals it may put an end to this price action and return to the uptrend soon. With an 8.5% price increase in the past seven days, it appears ready to test the key resistance at $0.55 and break above.
The support at $0.45 has held well and could be the push ADA needed to break the key resistance, which would then allow the price to rally all the way to $0.66, the next target should $0.55 fall. The indicators give a bullish bias, and the current volume favors bulls.
Looking ahead, expect to see ADA attempt a breakout from $0.55, which could embolden bulls to go straight to $0.66 next. Success there would mean Cardano can finally fully exit the flat trend established back in May. This would be extremely bullish if it happens.

Binance Coin (BNB)
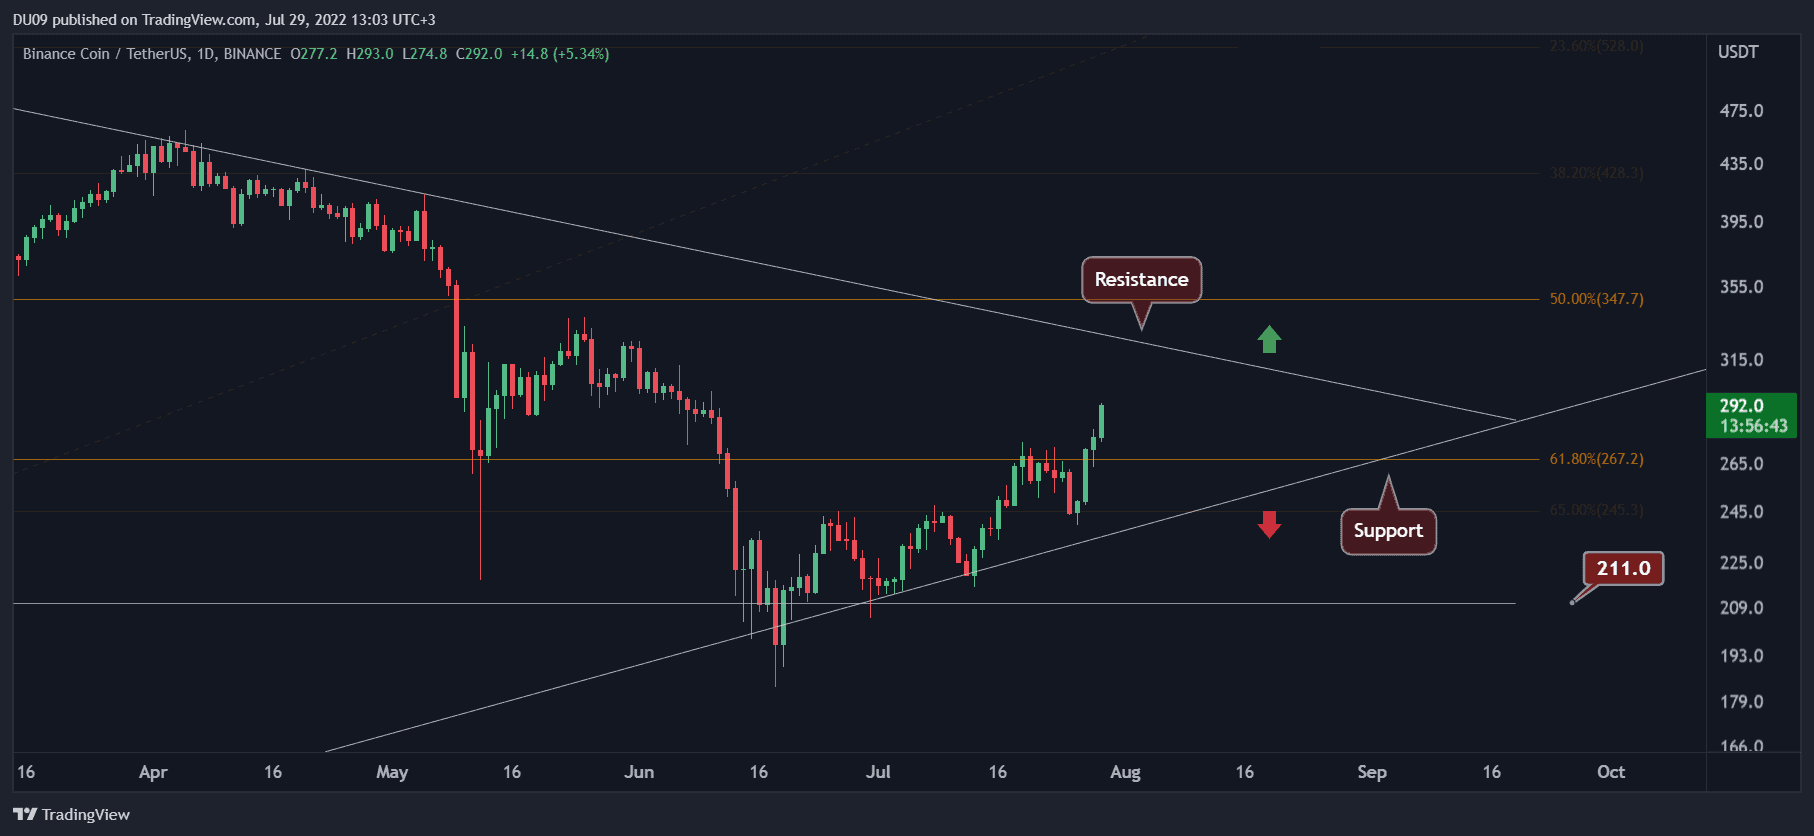
Binance Coin managed to confirm the $200 level as support in early July, and ever since, the price has been rallying higher. In the past seven days, it increased by 9.7% and is now well on its way to reaching the resistance at $300.
This latest rally follows a clean break from the resistance at $267, which has turned into support at the time of this post. Buyers appear to have returned to the market, and if this momentum continues, BNB could reach overbought levels on the RSI indicator that is approaching 70 points on the daily timeframe.
In the next few days, expect BNB to test the key resistance at $300, where bears may return to make a stand and stop the current rally. The indicators for BNB continue to give a bullish bias which makes continuation likely, at the time of this post.
Solana (SOL)
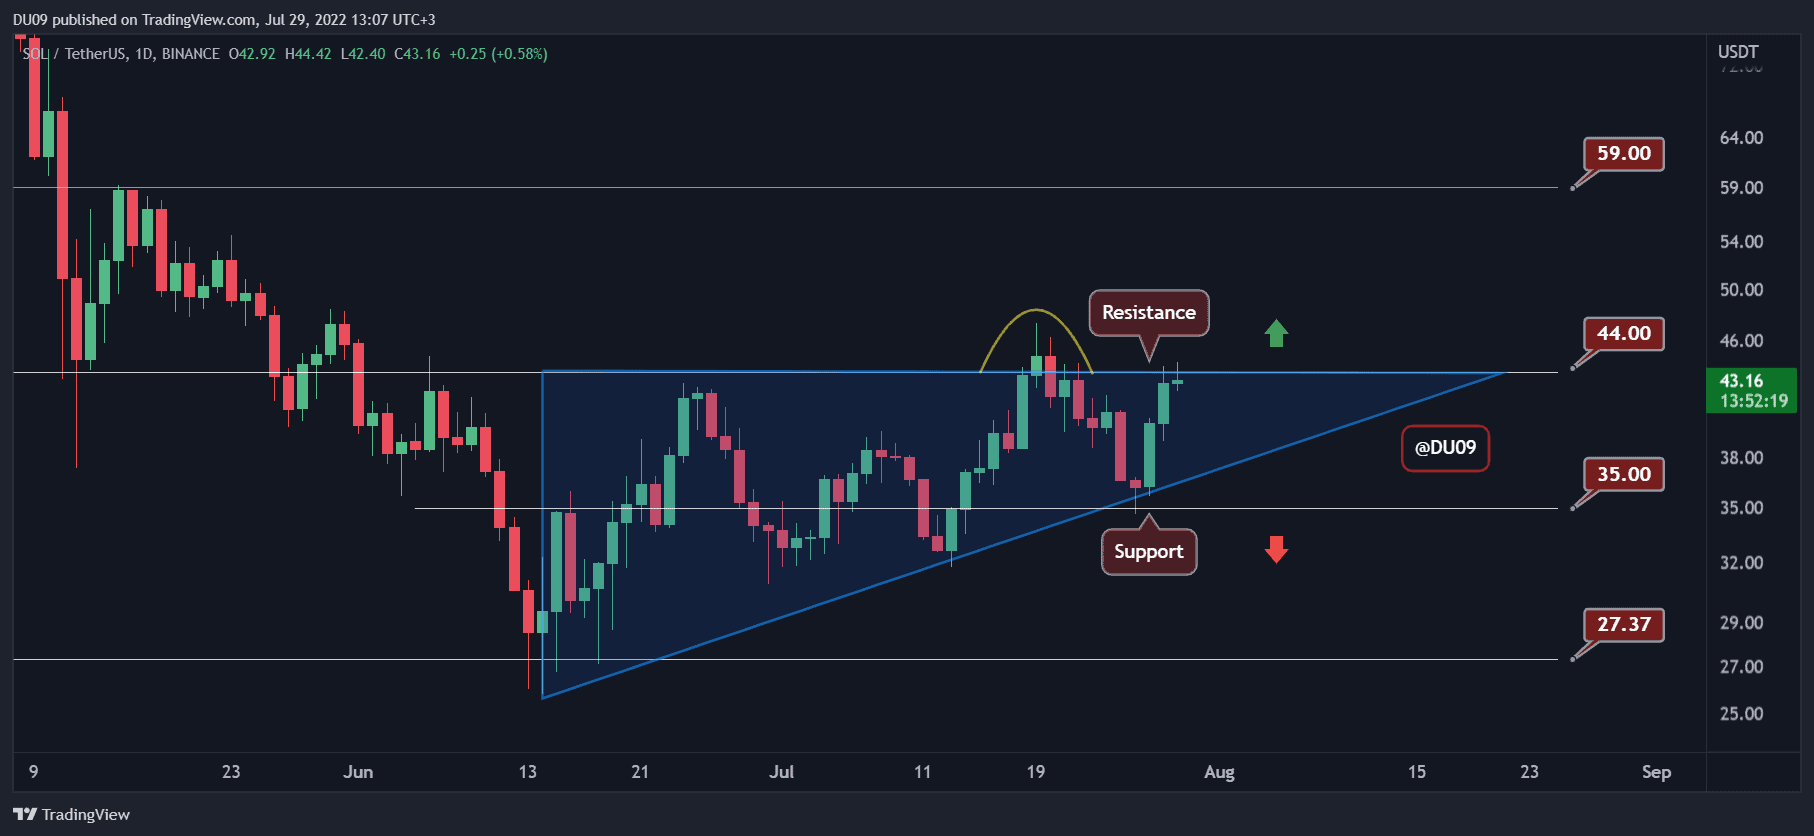
Solana failed to break above $44 despite several attempts to date. Now, the price is back at this key resistance level after a sustained rally from the key support at $35.
The price has also formed a large ascending triangle (in blue) and is quickly approaching the end of this formation, which will make a breakout very likely. The question is if SOL can manage to move above the key resistance at $44 and allow the price to rally higher towards $59.
While this formation gives a bullish bias, Solana has been left behind compared to other cryptocurrencies like ETH. For example, while ETH has made a higher high, Solana has failed to produce it. This shows weakness. Nevertheless, a break above the triangle appears more probable in the current market.