

Ethereum is trading at $2.1k, and the chart tells a story that three months of cautious optimism can no longer paper over. The ascending channel that has provided the structural backbone for every bullish argument since the February bottom is getting broken to the downside.
Moreover, the US institutional bid that supported the recovery through March and April has quietly retreated to its most negative reading since the capitulation lows. Therefore, ETH is seemingly not pulling back. It is breaking down.
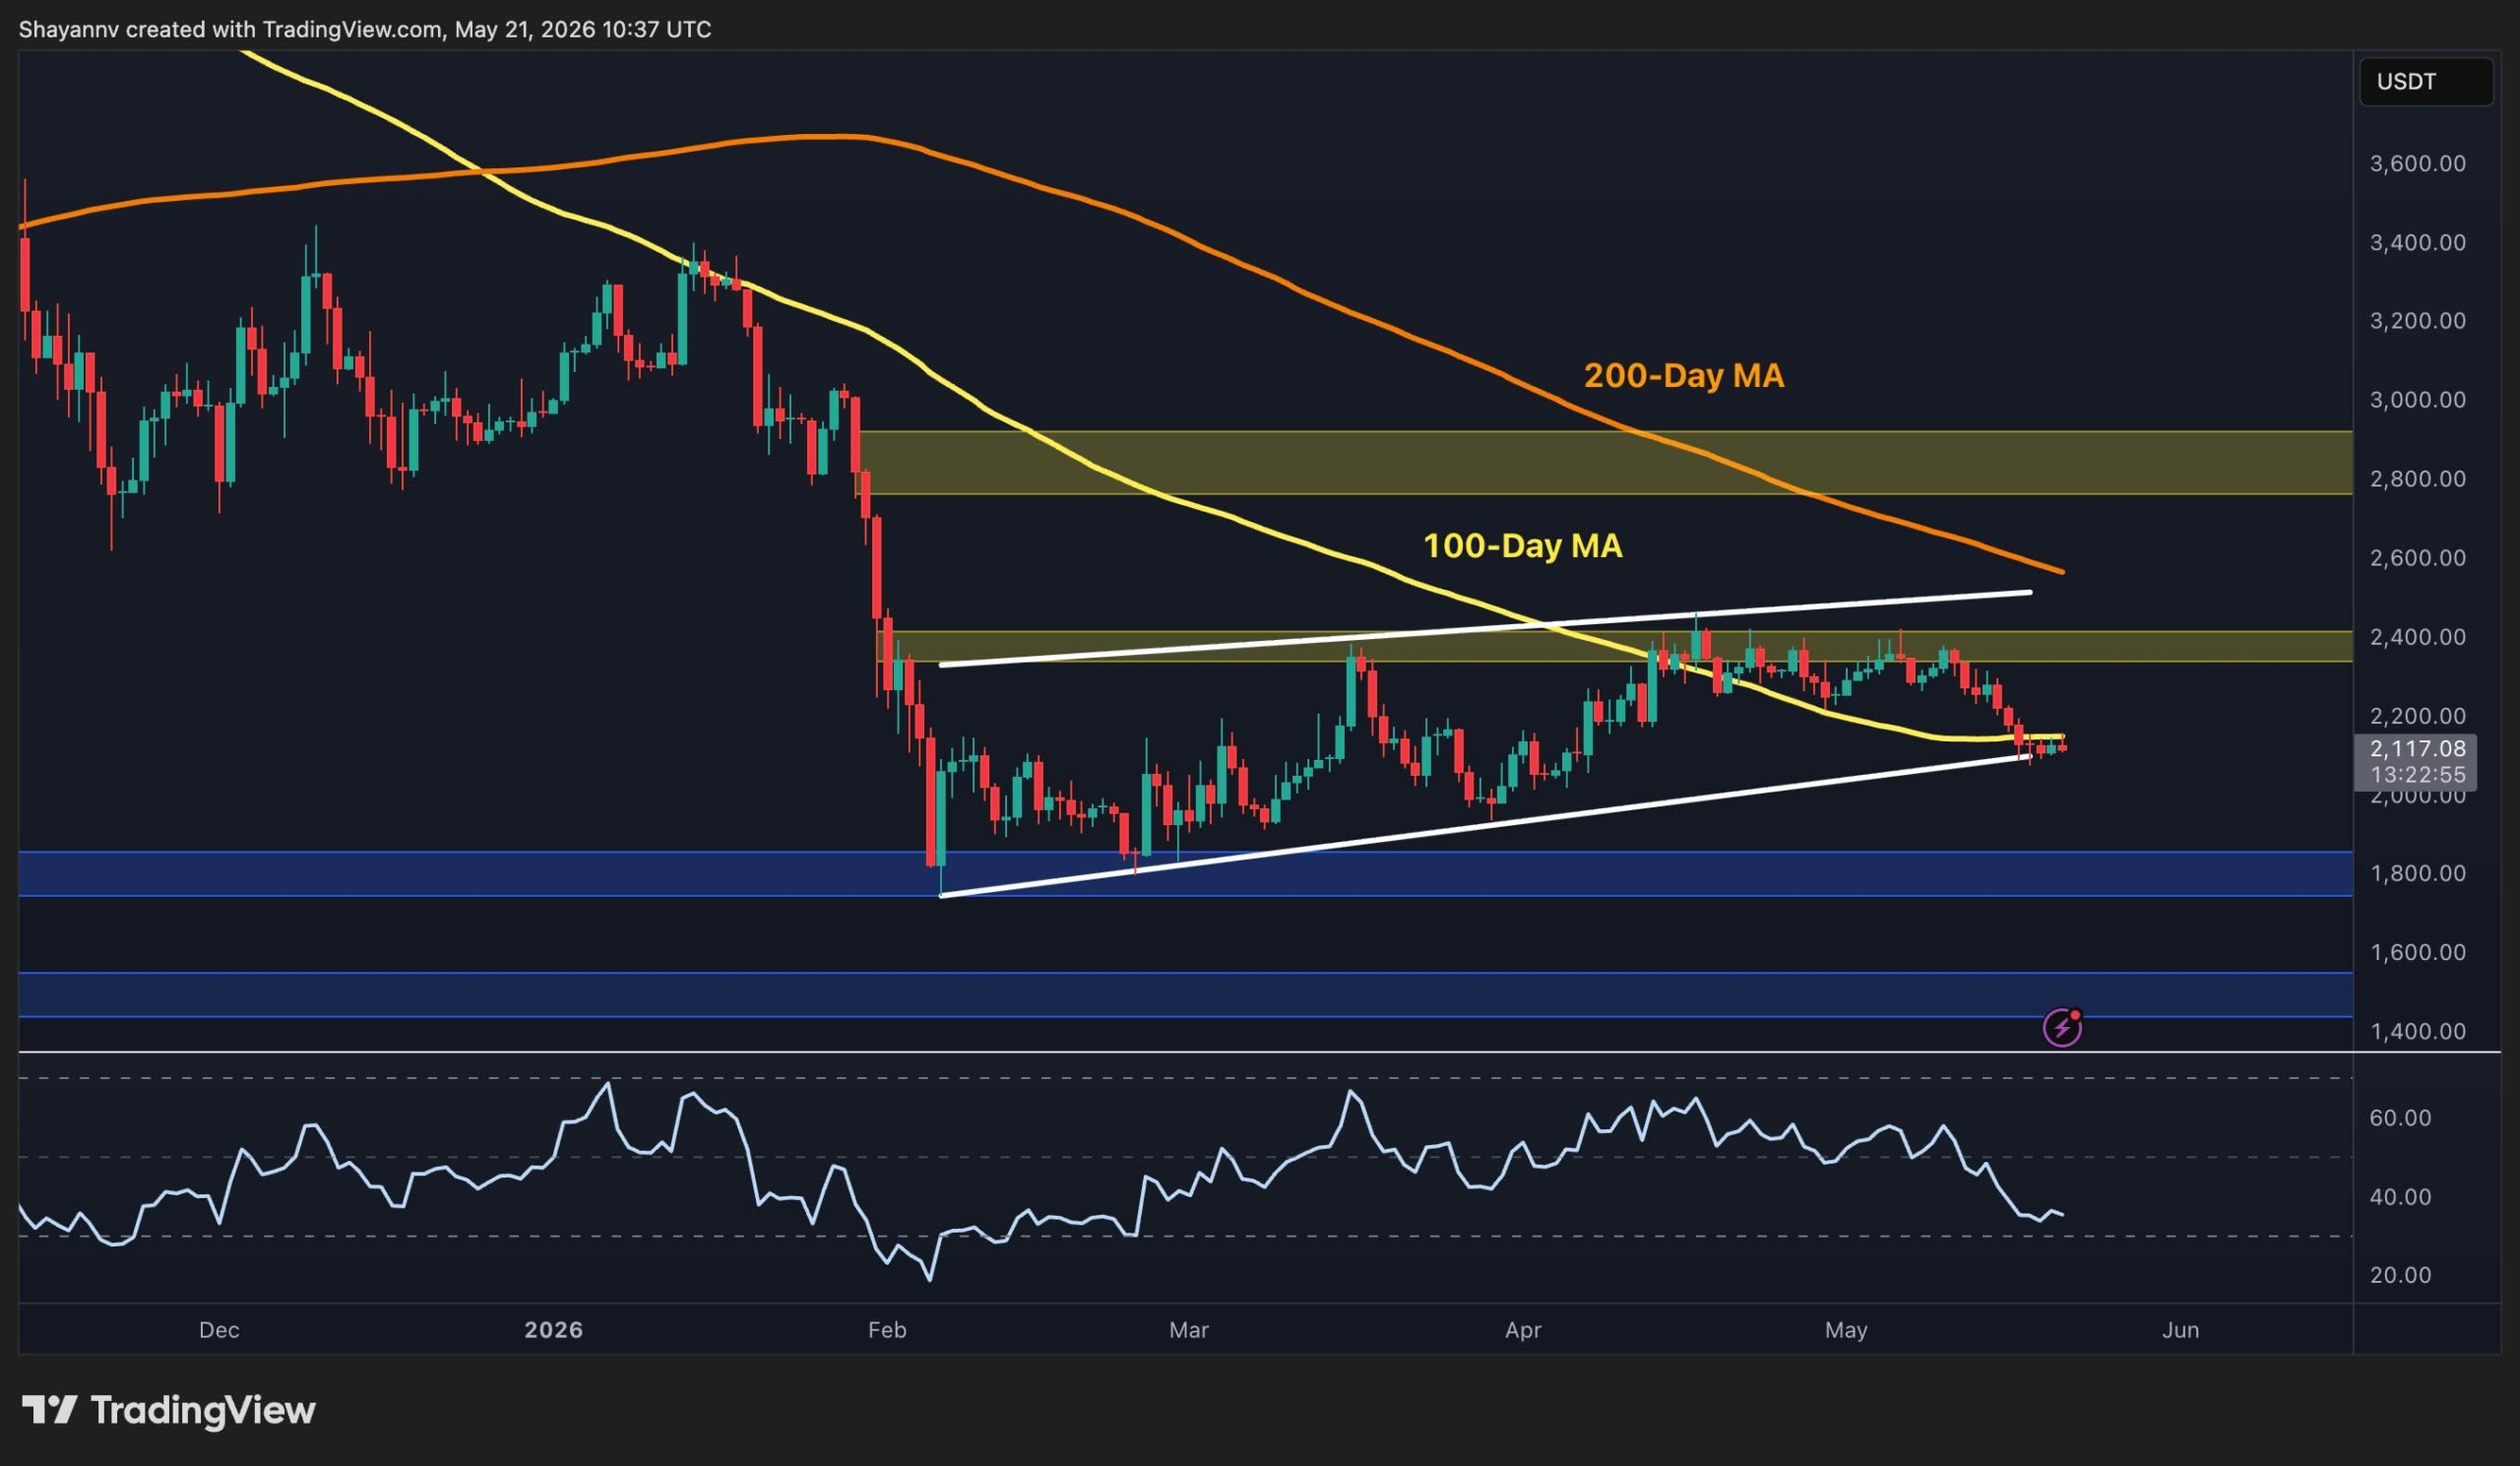
Ethereum Price Analysis: The Daily Chart
The ascending daily channel from the February low is failing. The asset is breaking below its lower boundary for the first time since the recovery began, and the 100-day moving average, which sat at approximately $2.2k and is still nearby, has been lost on a daily closing basis. The RSI has also declined below 40. This is its weakest daily reading since February’s capitulation, with no sign of a momentum floor forming yet.
The $1.8k demand zone is now the primary downside reference, having held as the absolute floor during February’s sell-off. Above, the lost 100-day moving average at the $2.2k zone now acts as immediate resistance. Reclaiming the $2.2k area on a sustained daily close is the minimum requirement to suggest this breakdown is a fakeout rather than a real structural shift.
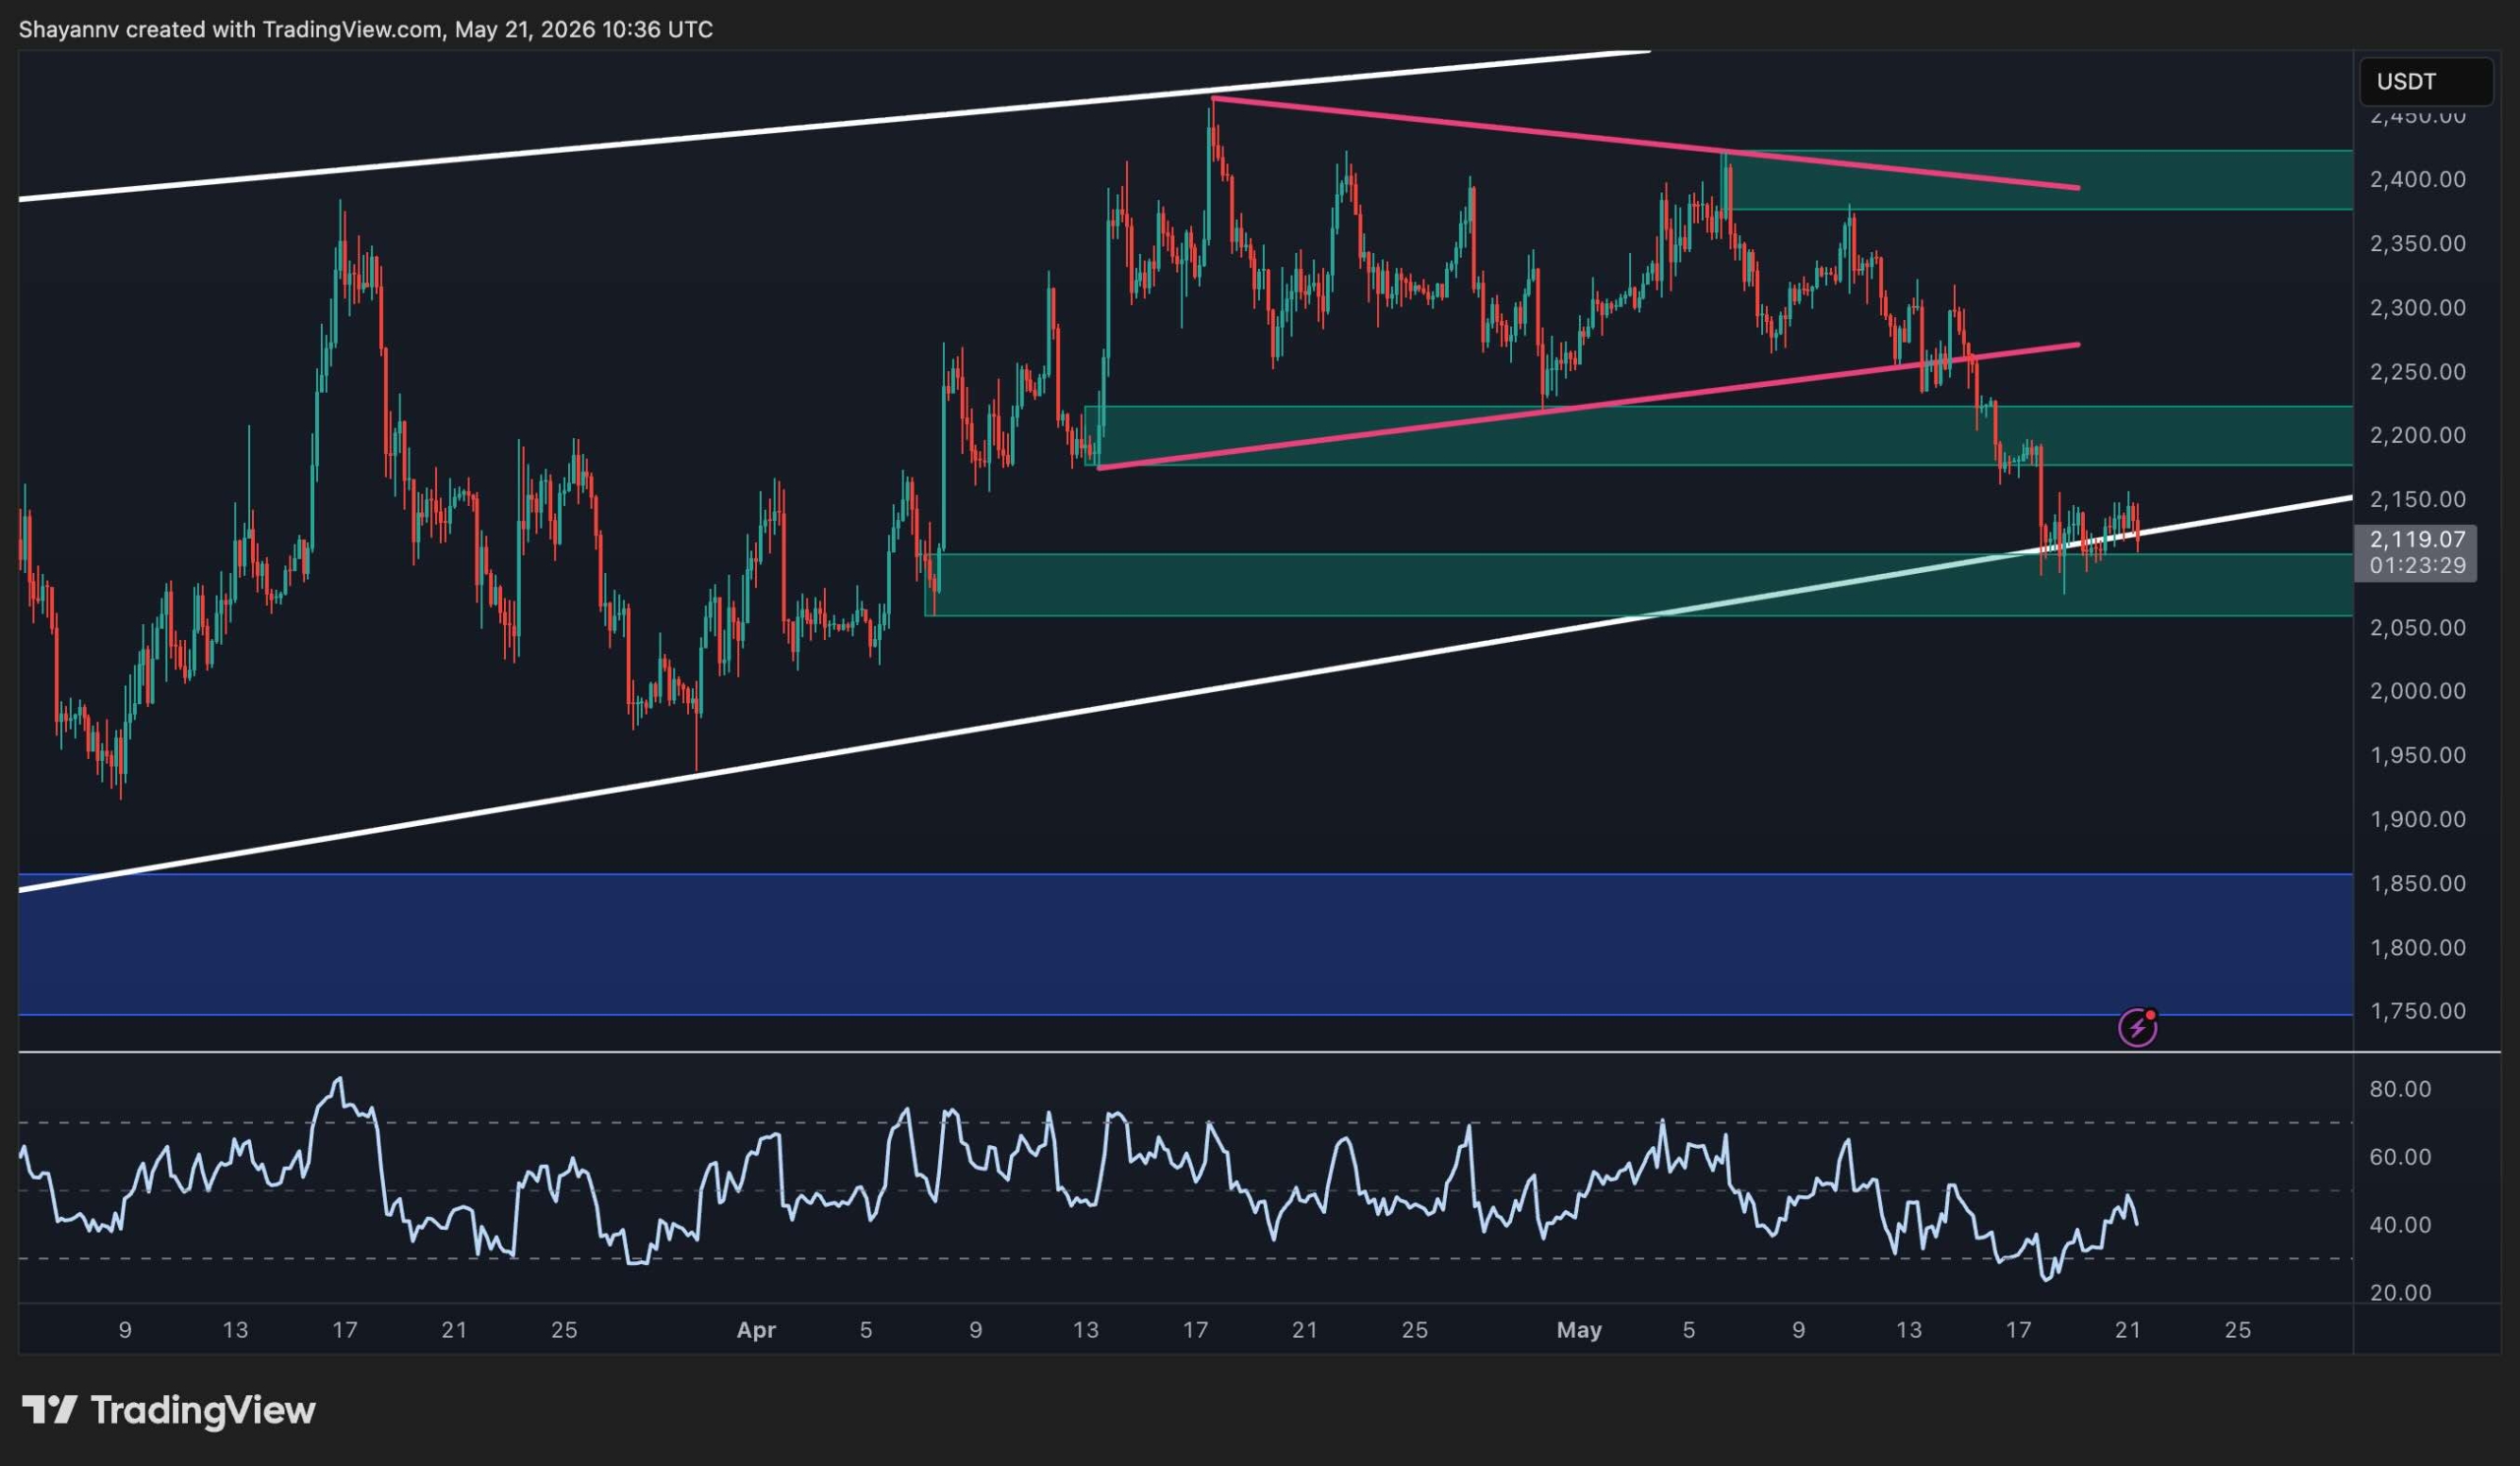
ETH/USDT 4-Hour Chart
On the 4-hour timeframe, the inner symmetrical triangle has resolved fully to the downside, taking the $2.2k support zone with it, which was a level that held on two prior occasions. The price is now sitting directly on the lower zone at $2.05k–$2.1k, which aligns almost precisely with the daily ascending channel’s lower boundary.
The 4-hour RSI has bounced modestly from the oversold low reached during the sharpest leg of the recent sell-off, and is recovering to the 40s. This should be viewed as a dead cat bounce until proven otherwise.
The current area at $2k-$2.1k is the last meaningful support before $1.8k. A 4-hour close below this area removes the final technical argument for the ascending channel structure and opens a direct path to the $1.8k demand zone below.
On the other hand, a sustained hold and recovery back above $2.2k would be the first sign that the breakdown is being absorbed. However, given the momentum behind this move, that recovery needs to happen quickly.
Sentiment Analysis
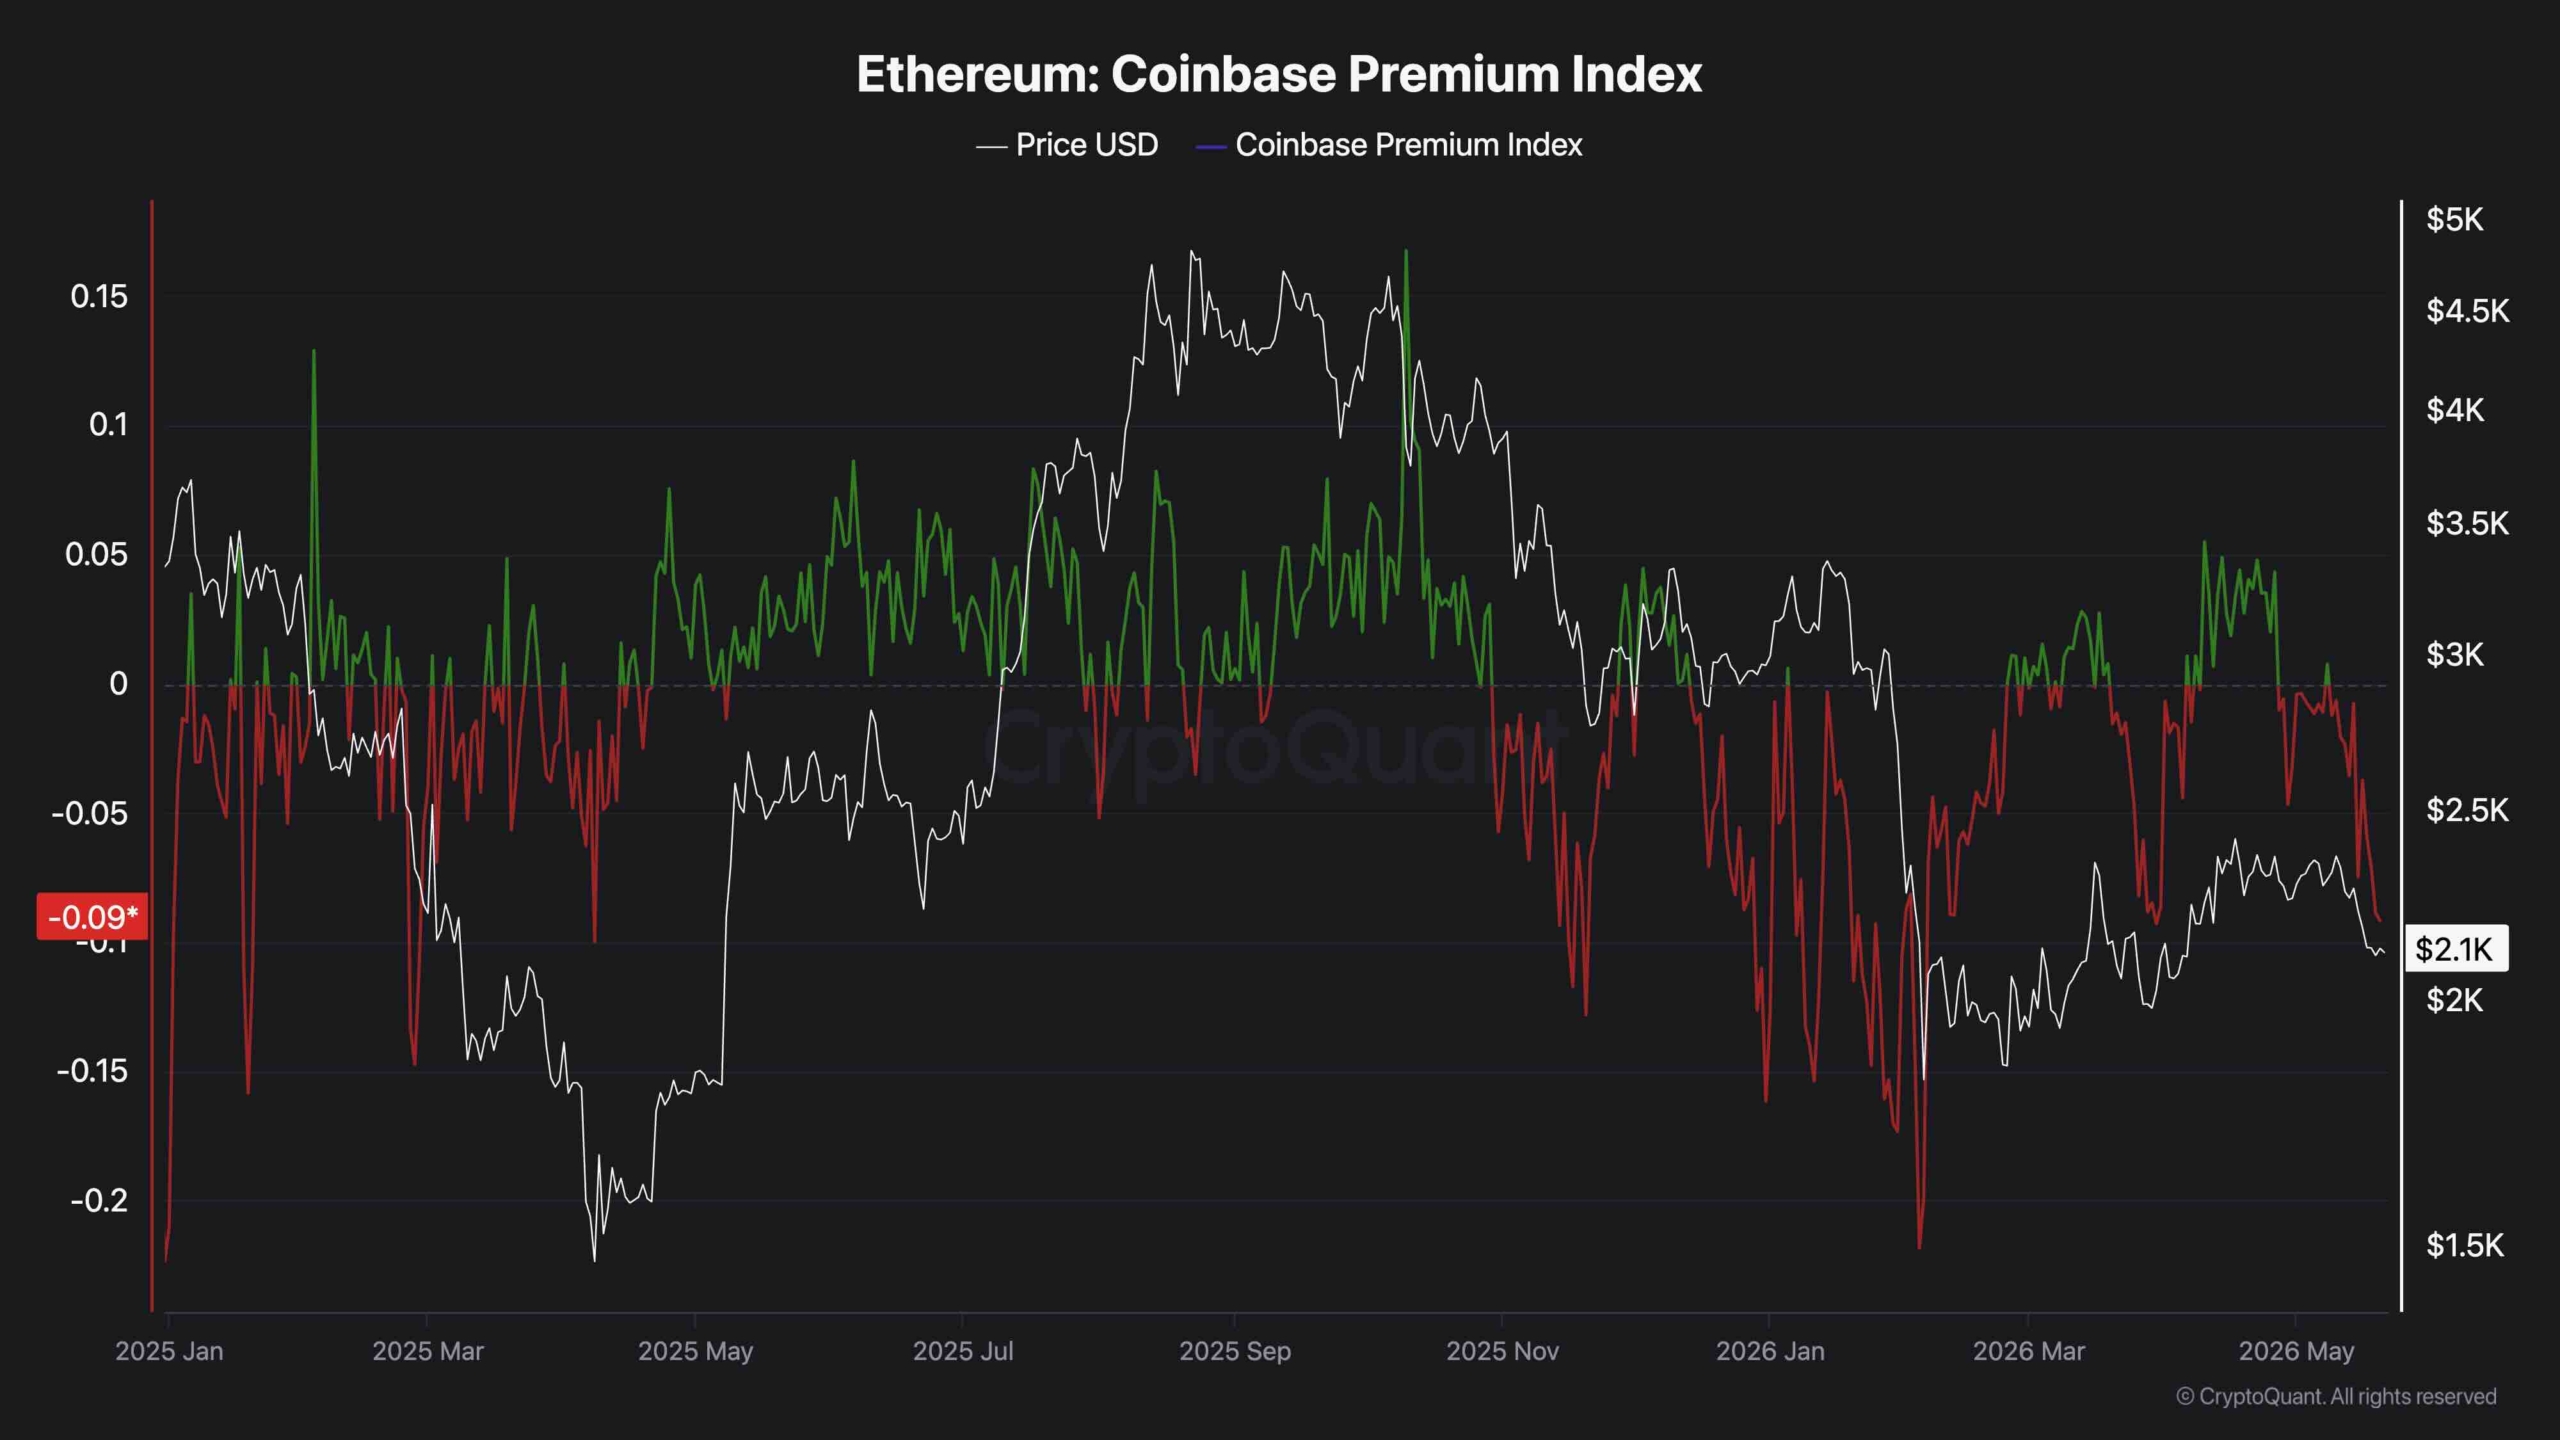
The Coinbase Premium Index has fallen to -0.09, which is the deepest negative reading since February’s capitulation low, and a sharp reversal from the slightly positive territory that characterized the March and April recovery. US buyers returned during the recovery (+0.02 to +0.08), stepped back at $2.4k resistance (premium faded to zero in early May), and have now actively retreated as the breakdown accelerated (-0.09).
The -0.09 reading is not yet at the -0.20 extreme seen at the February bottom, which means there is further room for US institutional selling to intensify if the price continues lower. What it confirms is that the cohort of buyers who provided the demand floor through the recovery is not stepping in to defend current levels. They are absent or net selling.
Without the Coinbase premium returning to sustained positive territory, any bounce from the $2.05k–2.1k support is likely to be sold rather than built upon, and the structural requirement for a genuine recovery is a reclaim of $2.2k with a positive Coinbase premium. Unless this happens, the bullish case has no credibility to stand on.
The post Ethereum Price Analysis: ETH Is Not Simply Pulling Back, It’s Breaking Down appeared first on CryptoPotato.