

Bitcoin has finally surpassed the 100-day moving average, which has been the most powerful resistance to the price for the last five months. After a short-term period of consolidation, the cryptocurrency went through another spike, returning the bullish sentiment to the market.
However, Bitcoin is soon to confirm a bullish trend reversal as the price has reached a significant resistance region and marked multiple bearish signs in lower timeframes.
Technical Analysis
By Shayan
The Daily Chart
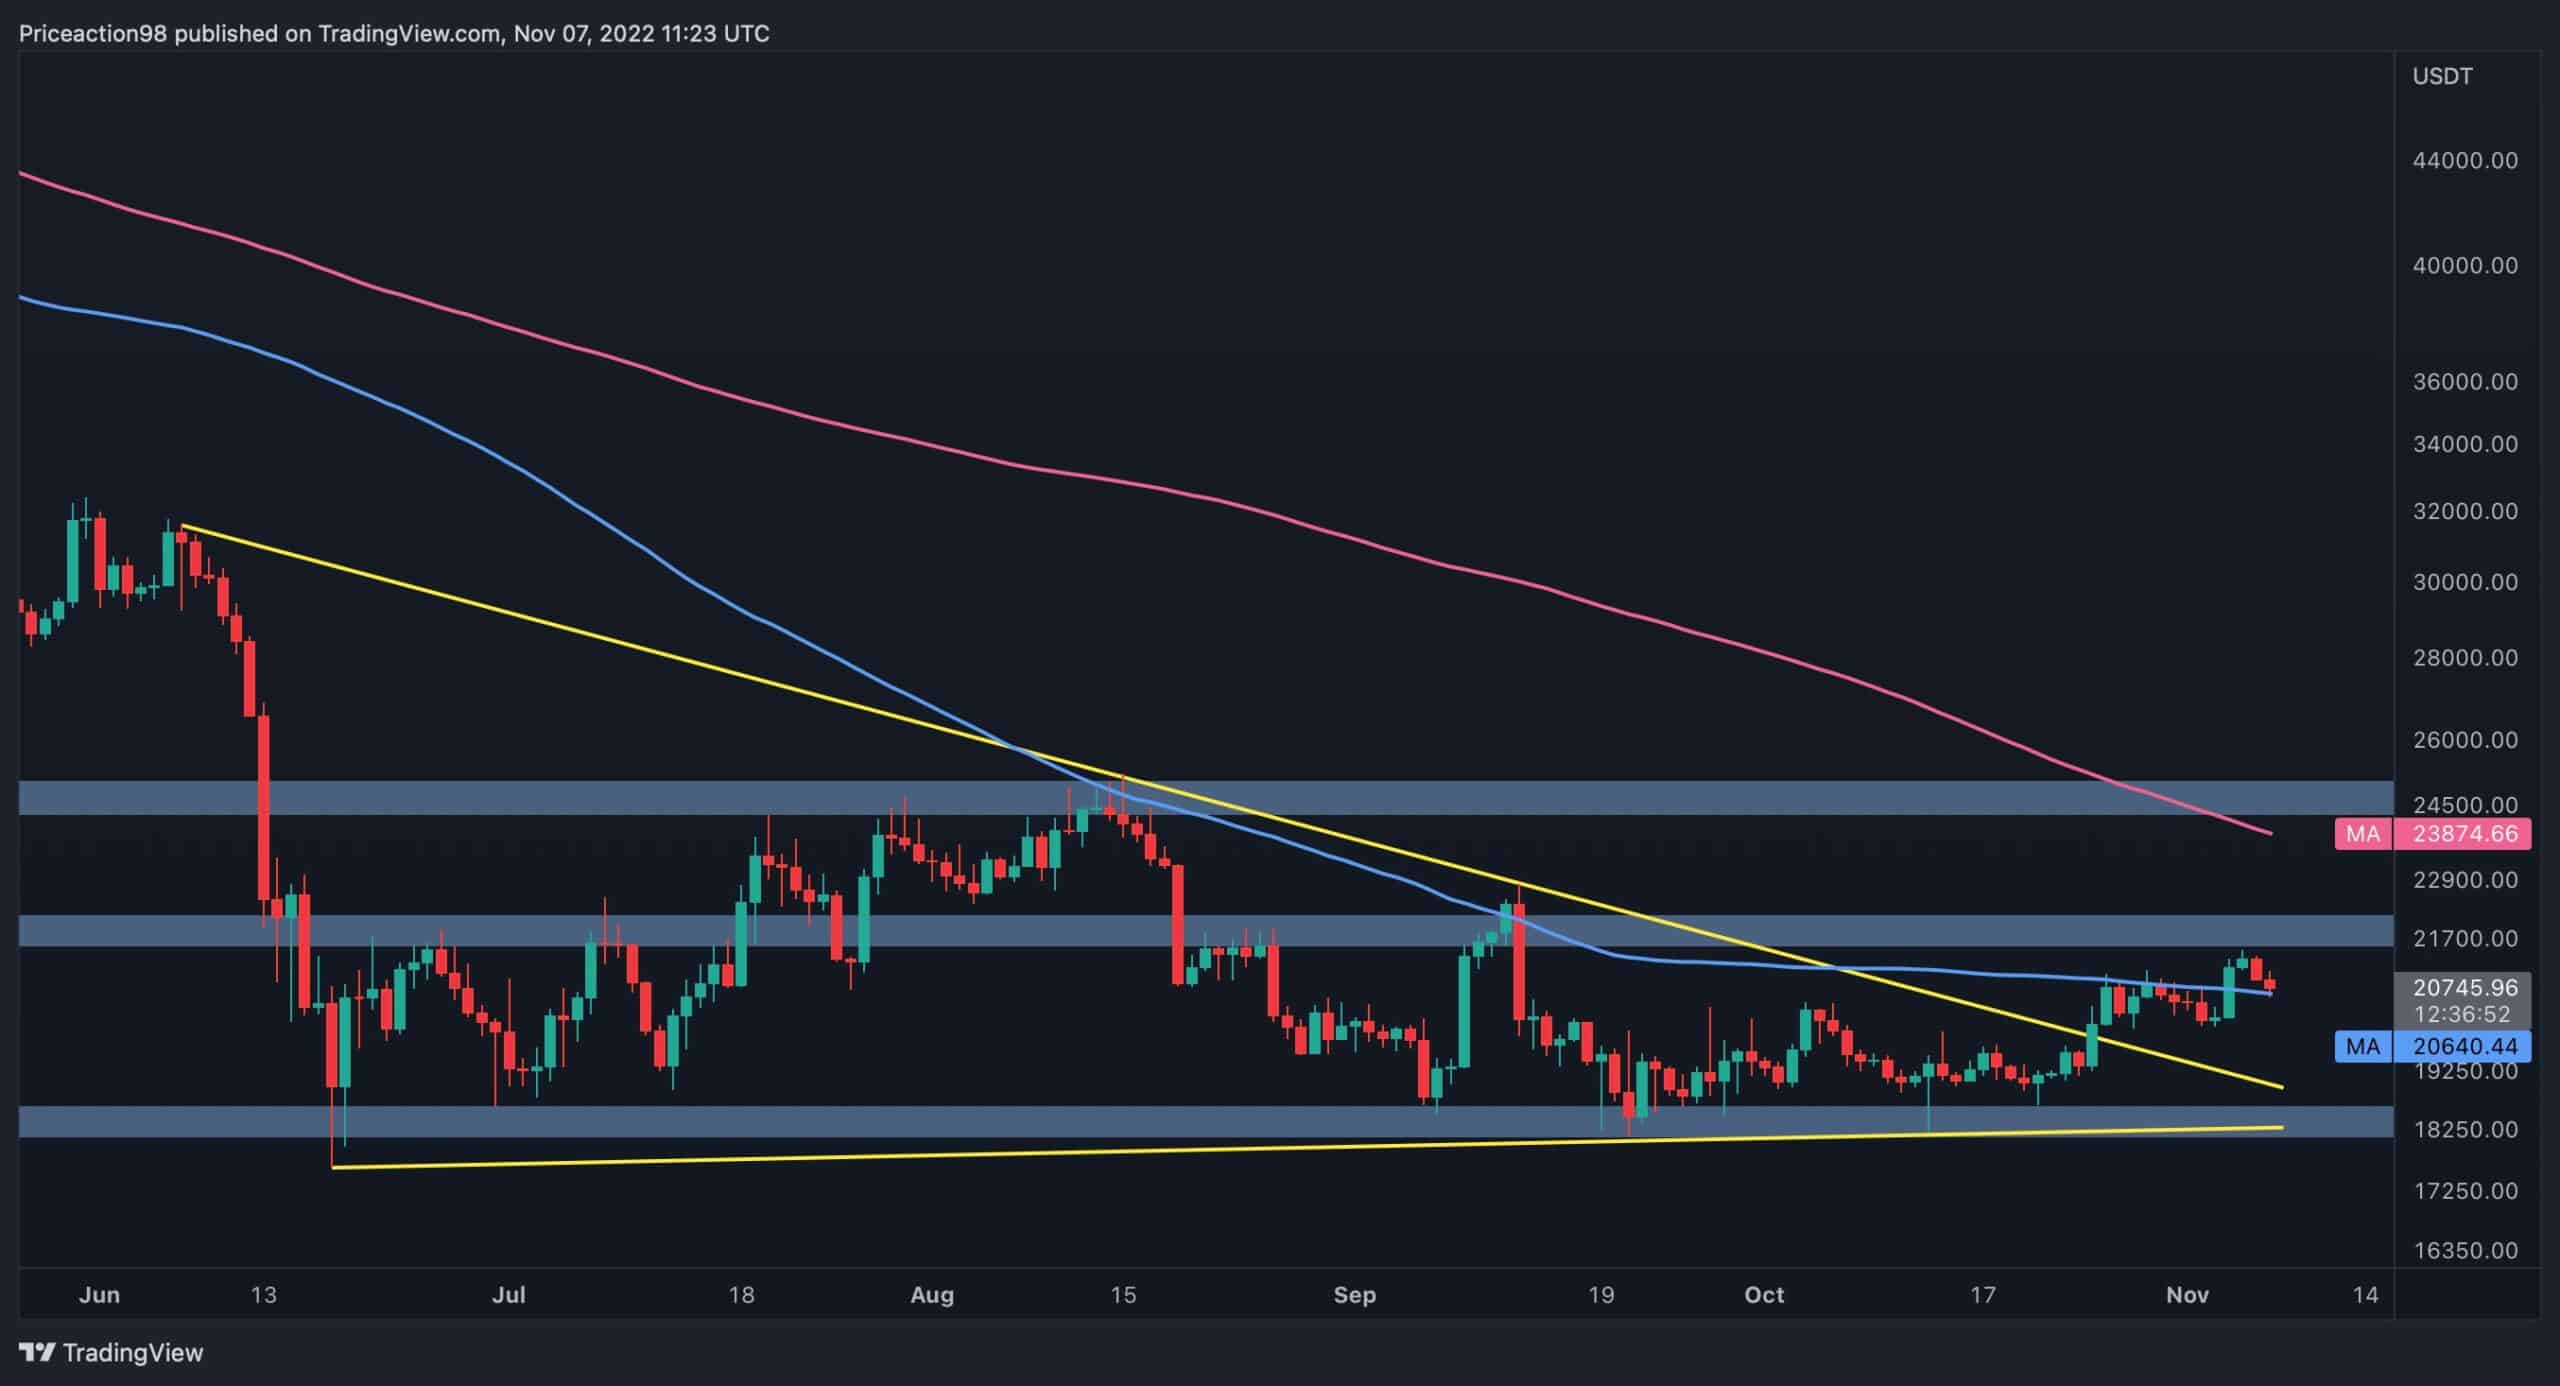
The price was repeatedly rejected from the 100-day moving average for several months until the significant resistance level was surpassed, and the $21.7K barrier was reached.
Bitcoin is currently retesting the moving average by forming a pullback. In the event of a successful pullback, another rally toward the $24K level will become a possibility.
On the other hand, a bullish breakout above the 200-day moving average – currently sitting at $23.5K – would theoretically mark the initiation of the new bull run. If the price surpasses this level, demand will presumably return to the market, and the rebound scenario will finally make sense.
However, considering the lower timeframe price action and the on-chain data, a bearish scenario followed by a rejection from this level seems more likely.
The 4-Hour Chart
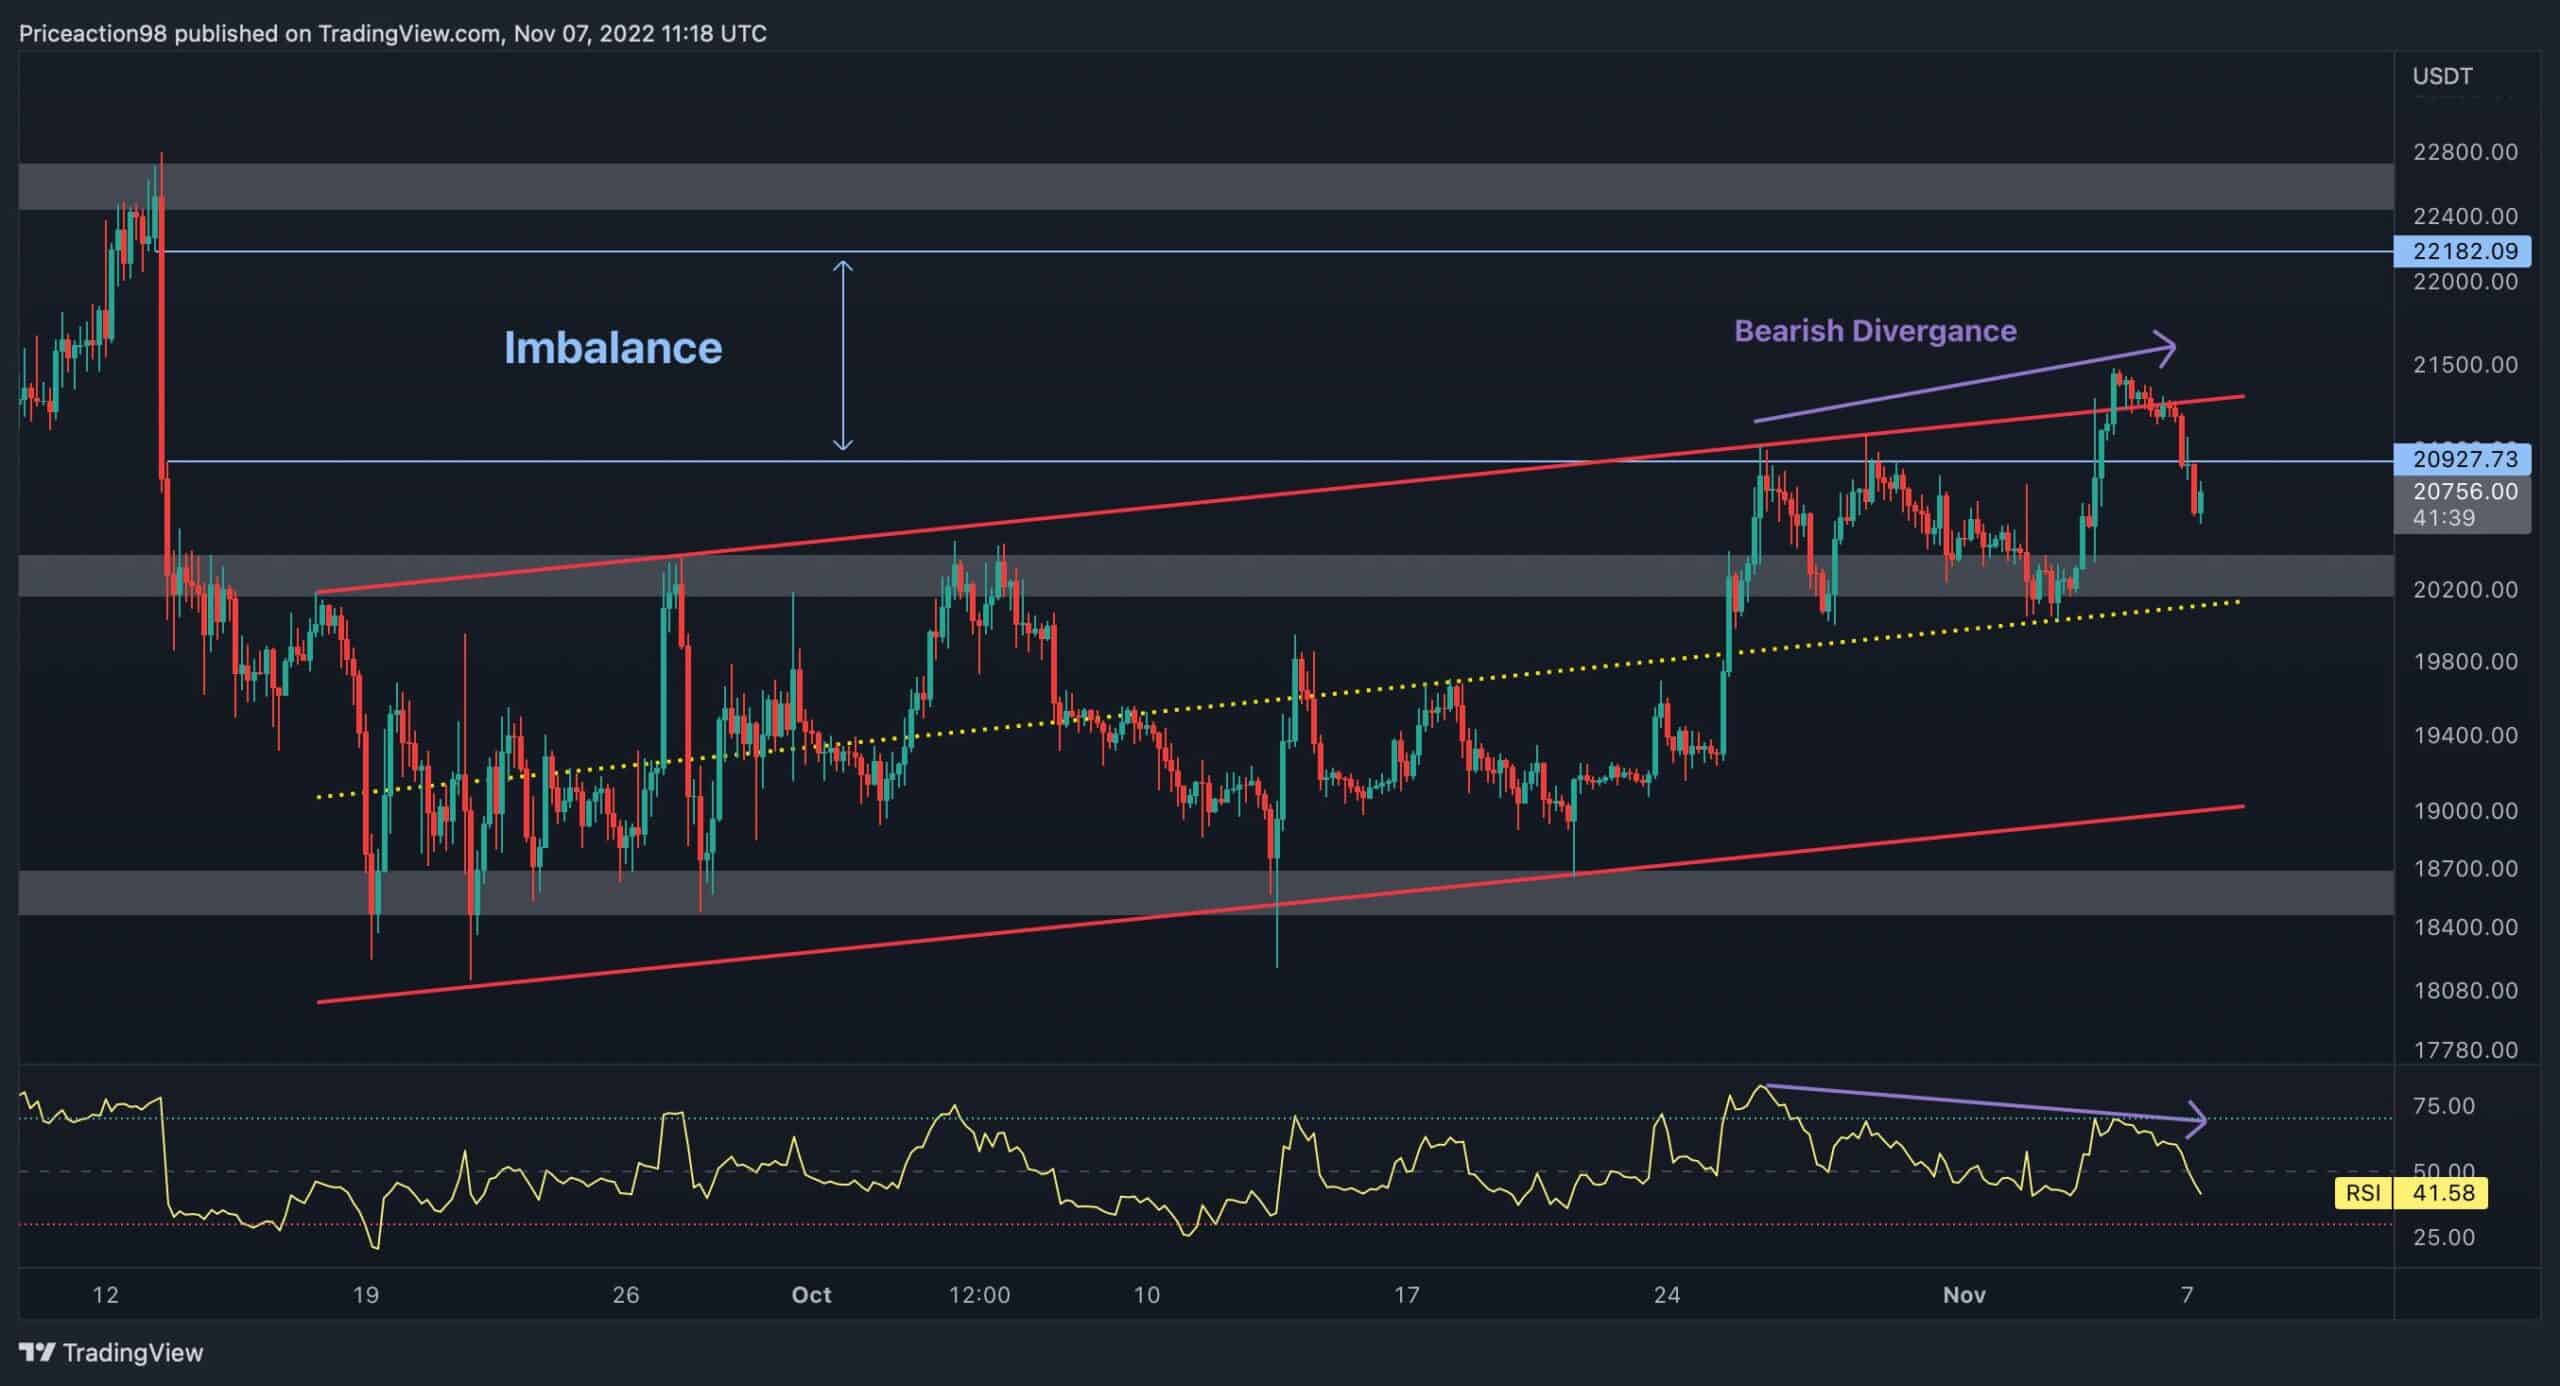
As stated in our prior analysis, a powerful bearish imbalance(also called a Fair Value Gap) exists between the $20.9K and $22.1K levels. The price finally broke the ascending bearish flag pattern to the upside and reached the 50% point of the imbalance. However, it was immediately rejected and, as a result, plummeted inside the flag.
Yet, there is an evident bearish divergence between the price and the RSI indicator. Considering the imbalance, a significant resistance for the price in lower timeframes, and the bearish divergence, BTC seems more likely to experience another cascade and retest the flag’s mid-boundary.
On-chain Analysis
Bitcoin’s price has recently recovered from the $18K region, forming several higher highs and lows. This market structure could suggest that the bulls are trying to create an uptrend.
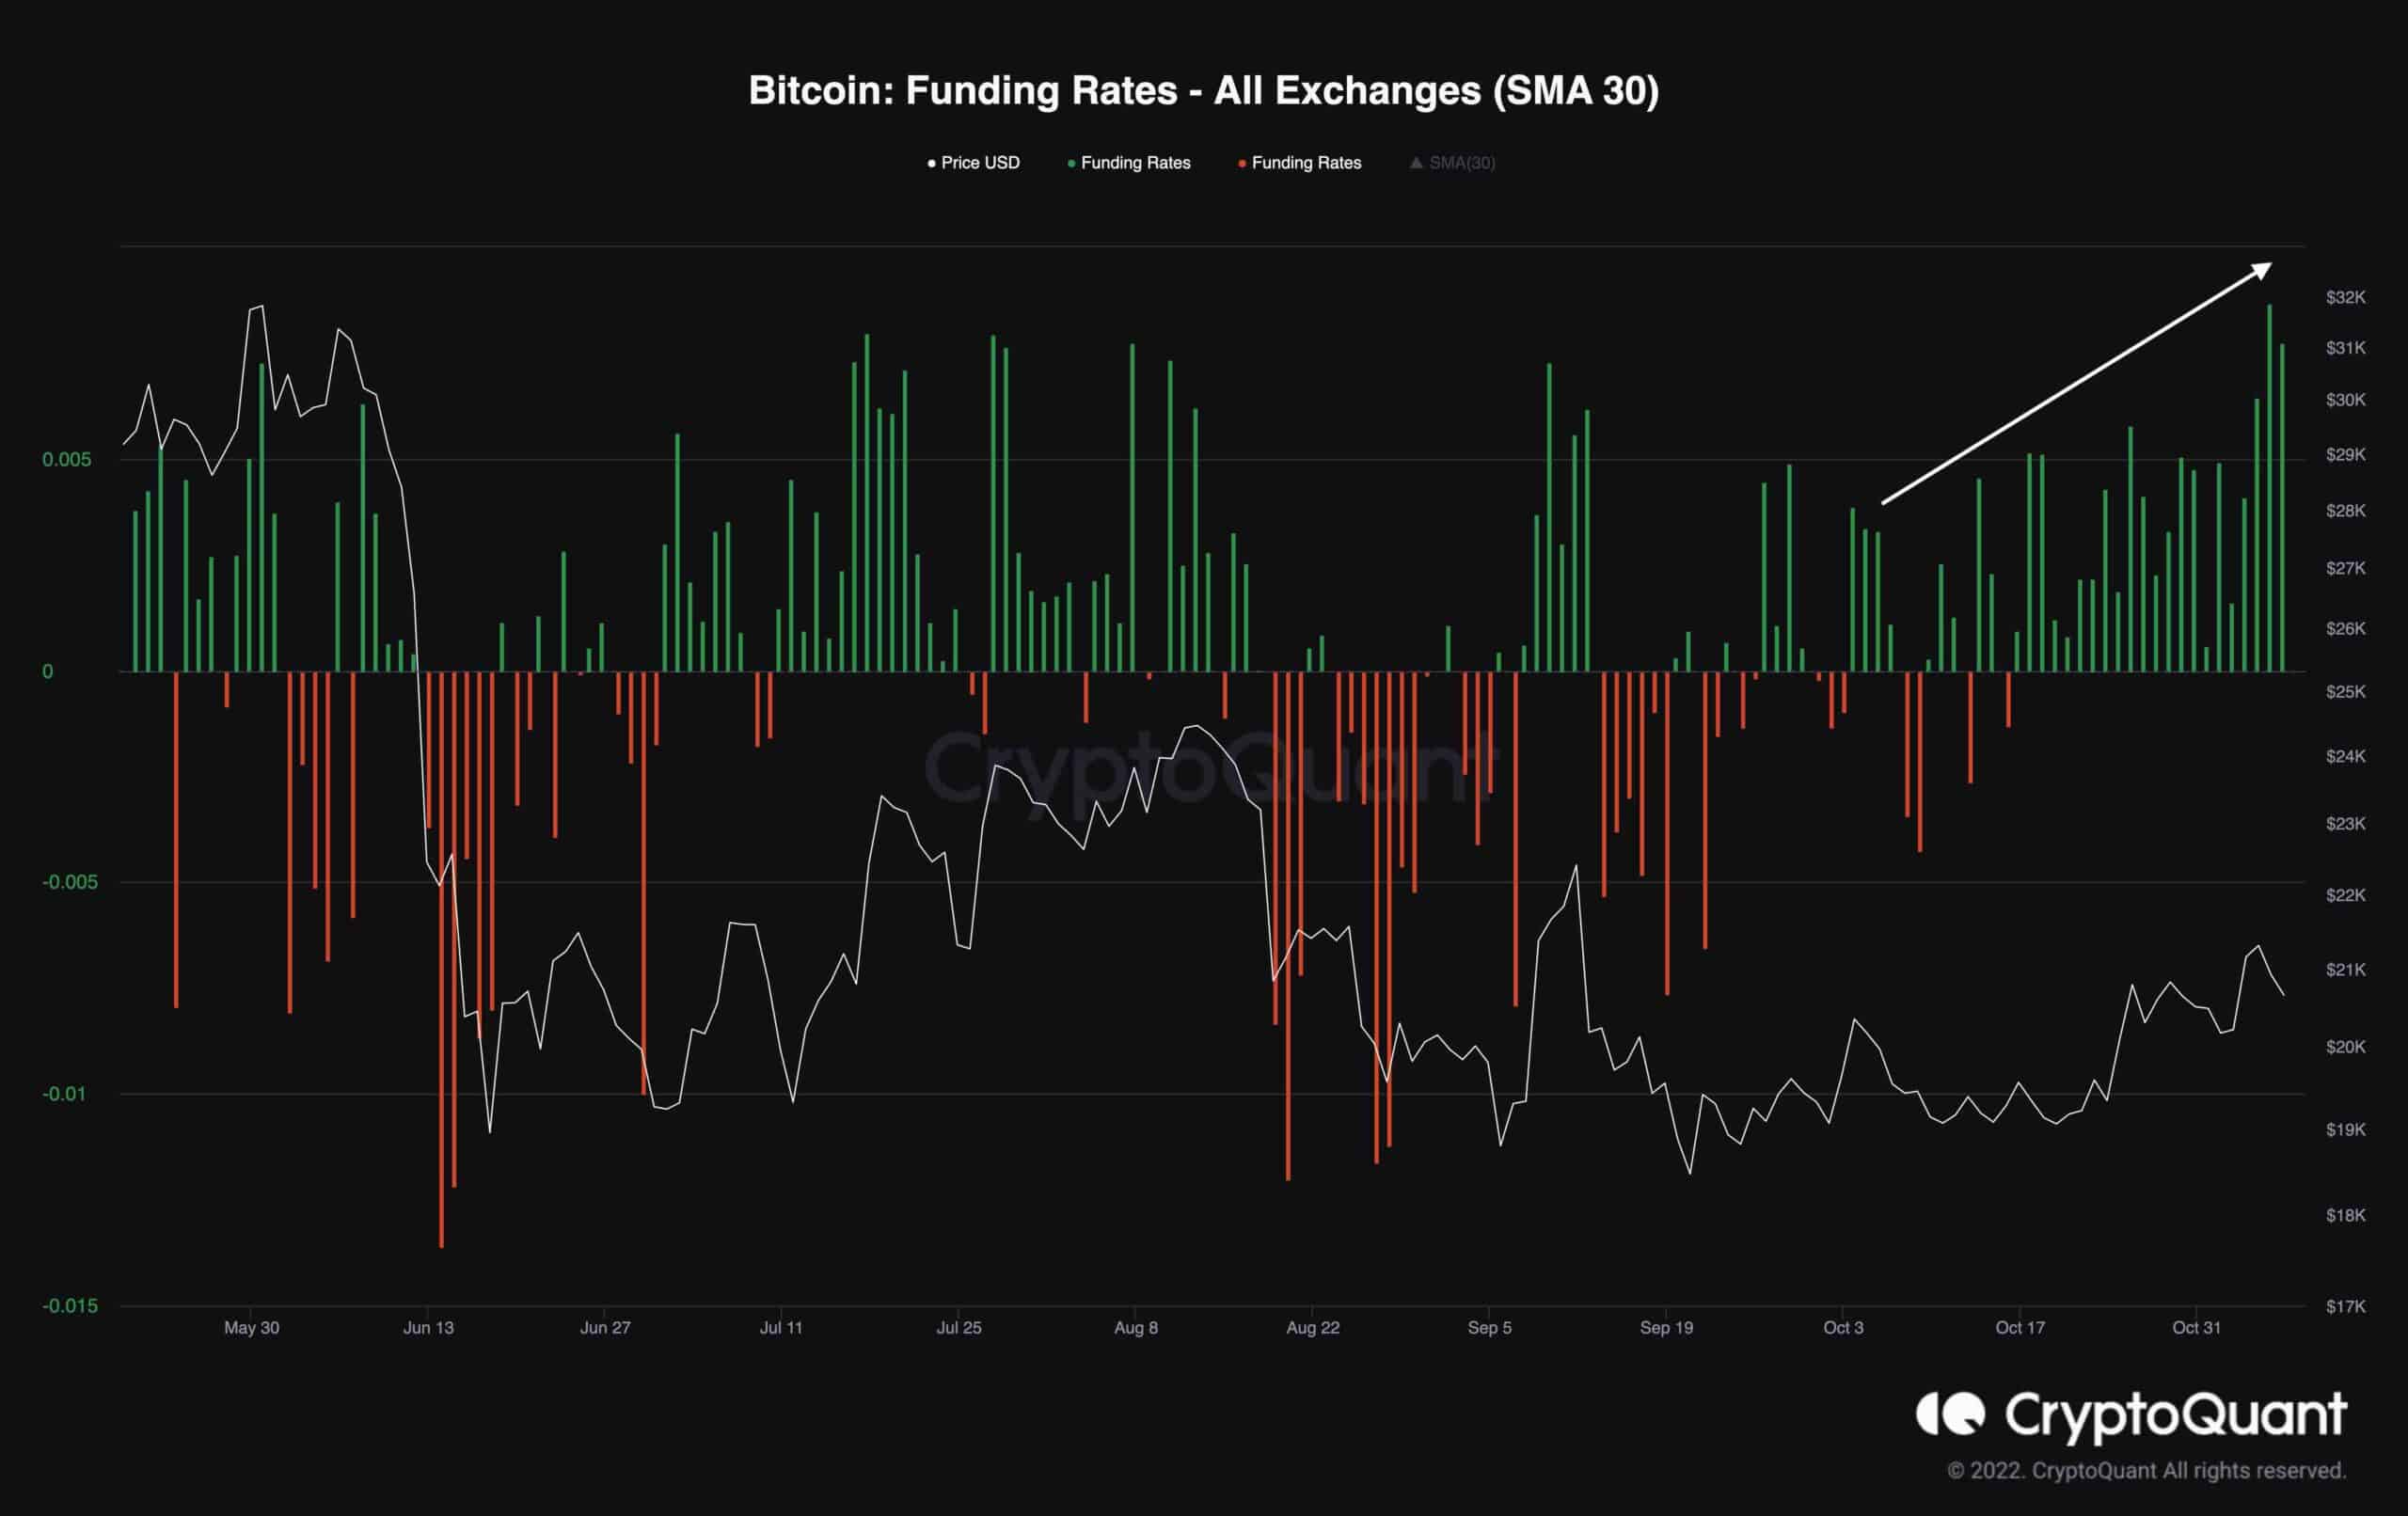
The funding rates, a proper metric to determine the futures market sentiment, have been printing positive values over the last few weeks. This suggests the dominance of bullish sentiment in the futures market.
However, the current positive values of the funding rates could be a trap that leads to a massive long squeeze, and the following liquidation flood could trigger another substantial drop and bearish continuation below the $20K mark.
To summarize, it likely wouldn’t be wise to rule out the bearish scenario entirely, as higher values of the funding rates might result in more volatility in the short term.
The post Worrying Signs for BTC But is a Drop Below $20K in Play? (Bitcoin Price Analysis) appeared first on CryptoPotato.