

Ripple has had three daily green candles. Buyers were able to push the price by 15% until the time of writing. But the main question is if this rally is strong enough to pause the bearish trend in the mid-term.
Technical Analysis
By Grizzly
The Daily Chart
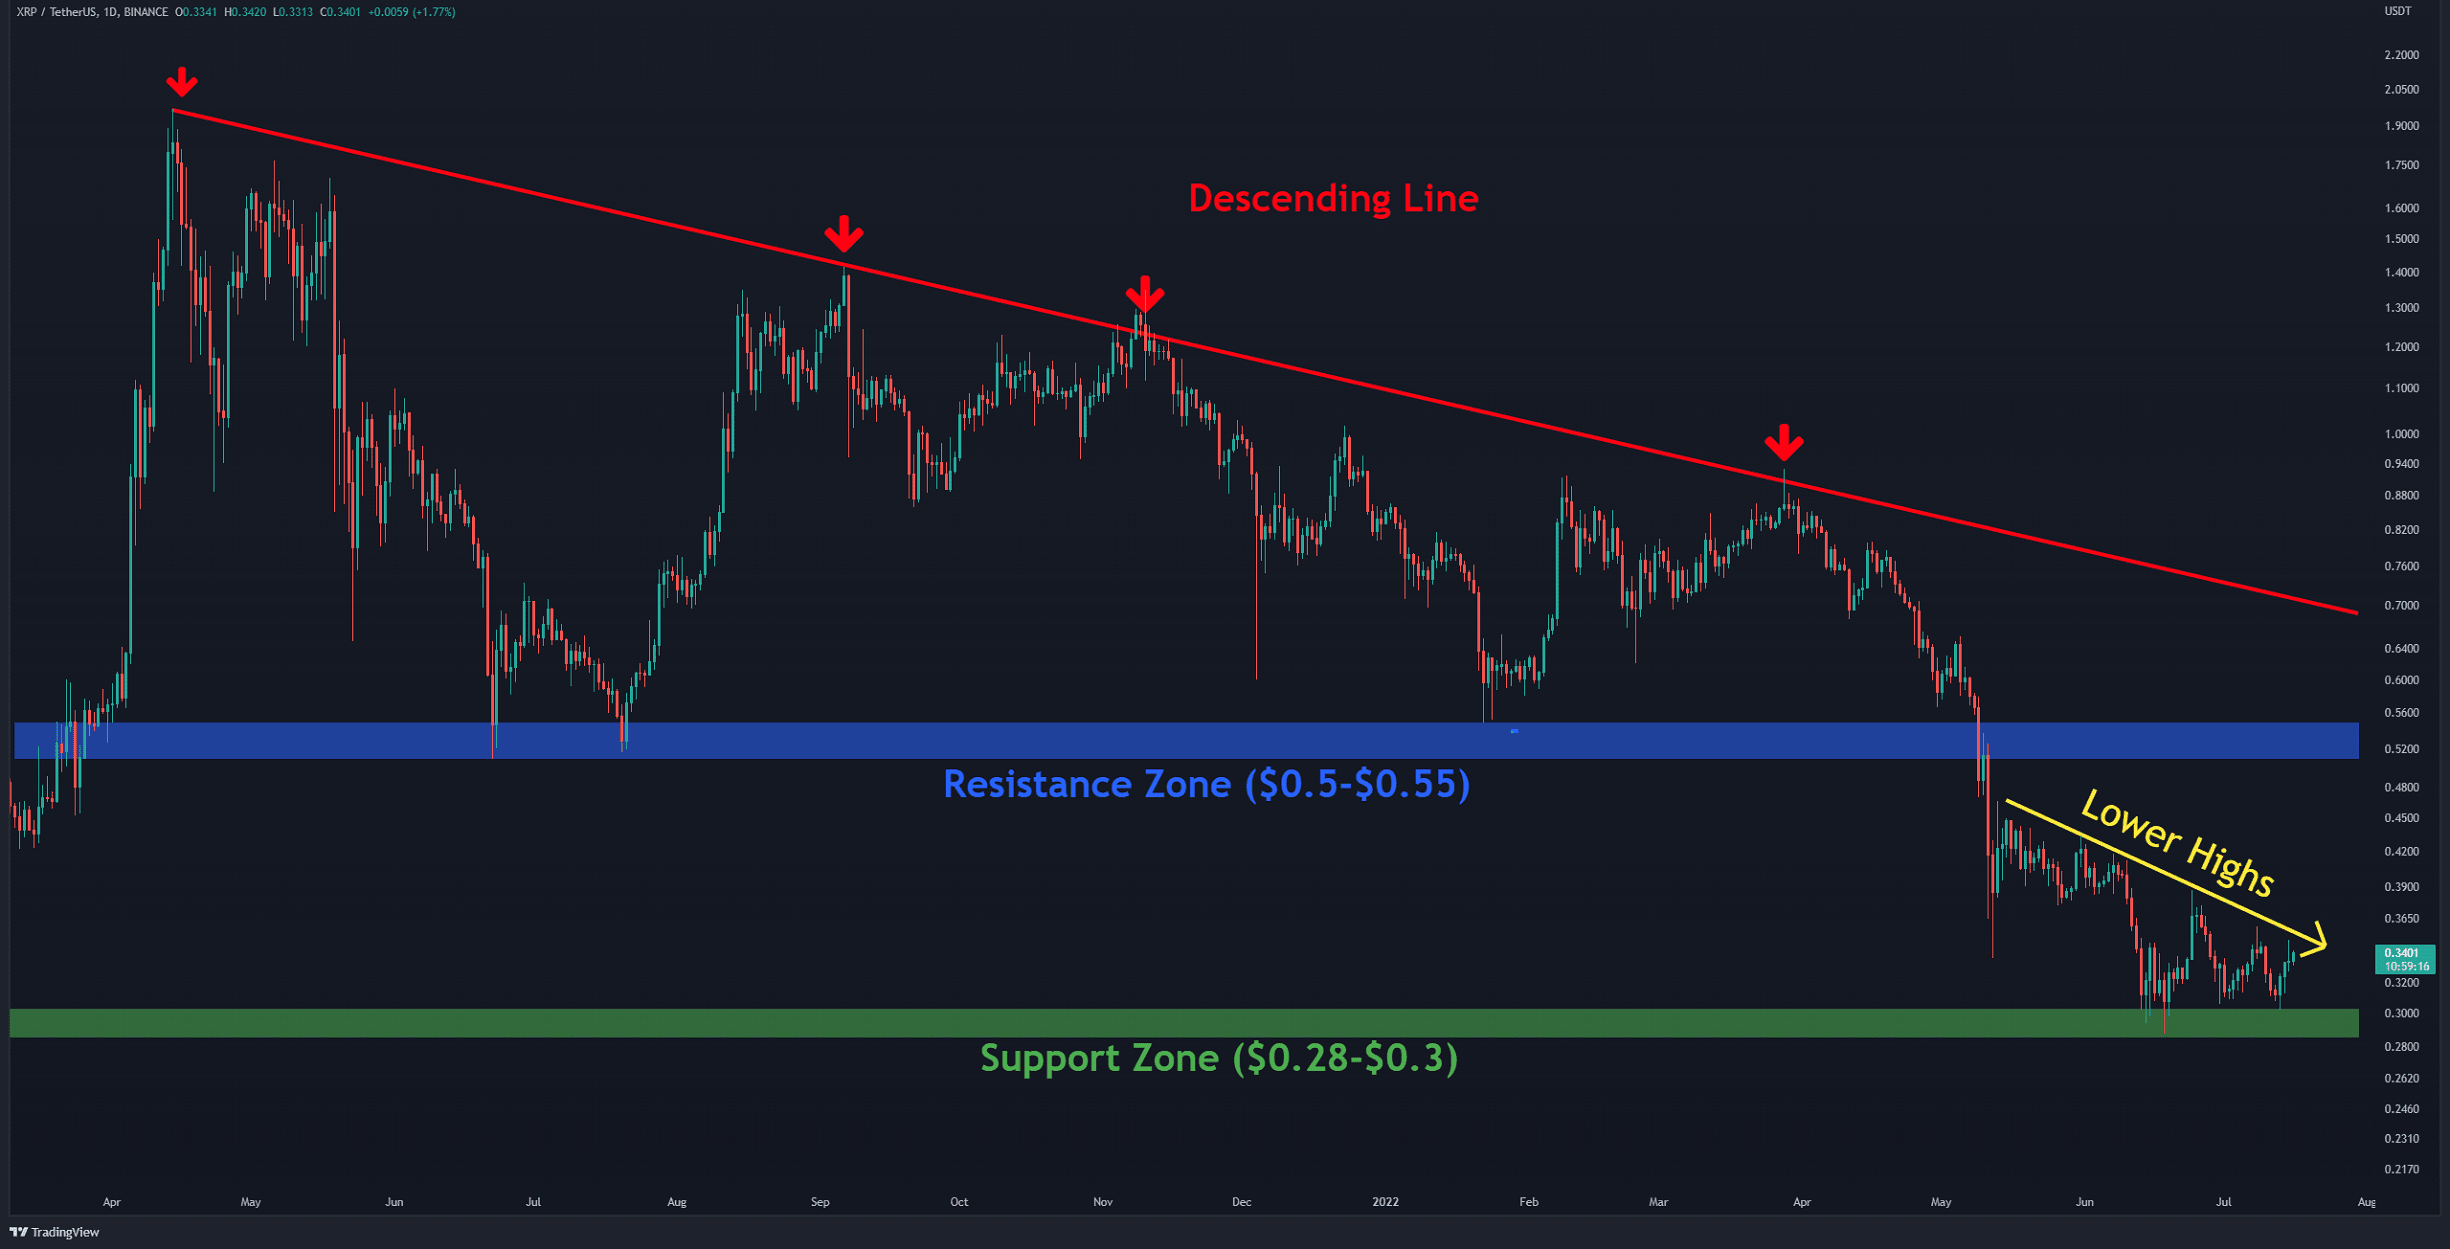
Ripple has not been able to make a higher high on a daily timeframe for a lengthy period. Since May 2022, the sellers have prevented the bulls from breaking above the last high (in yellow). As a first step to see a trend reversal, XRP must be able to form a higher high above $0.4.
In this case, the bearish momentum could start to decrease gradually. Then, the bulls ought to break the horizontal resistance at $0.50-$0.55 (in blue) before retesting the descending line (in red). Breaking the red dynamic resistance that has been shadowing the price for a long time can be a considerably positive sign for Ripple.
All the mentioned points are valid if the buyers defend the support zone at $0.28-$0.3 (in green). If the sellers push the price below that, a long-term bearish market awaits Ripple.
Key Support Levels: $0.28 & $0.24
Key Resistance Levels: $0.40 & $0.50
Moving Averages:
MA20: $0.33
MA50: $0.35
MA100: $0.47
MA200: $0.61
The XRP/BTC Chart
The bulls retested the horizontal resistance against BTC at 1800-1700 SATs (in red). The selling pressure from the upside formed a daily candle with a long upper shadow. If the buyers defend the horizontal support at 1500 SATs (in green) and do not allow the price to go below it, the price could retest the red resistance zone. The more this zone is tested, the more likely it is to break.
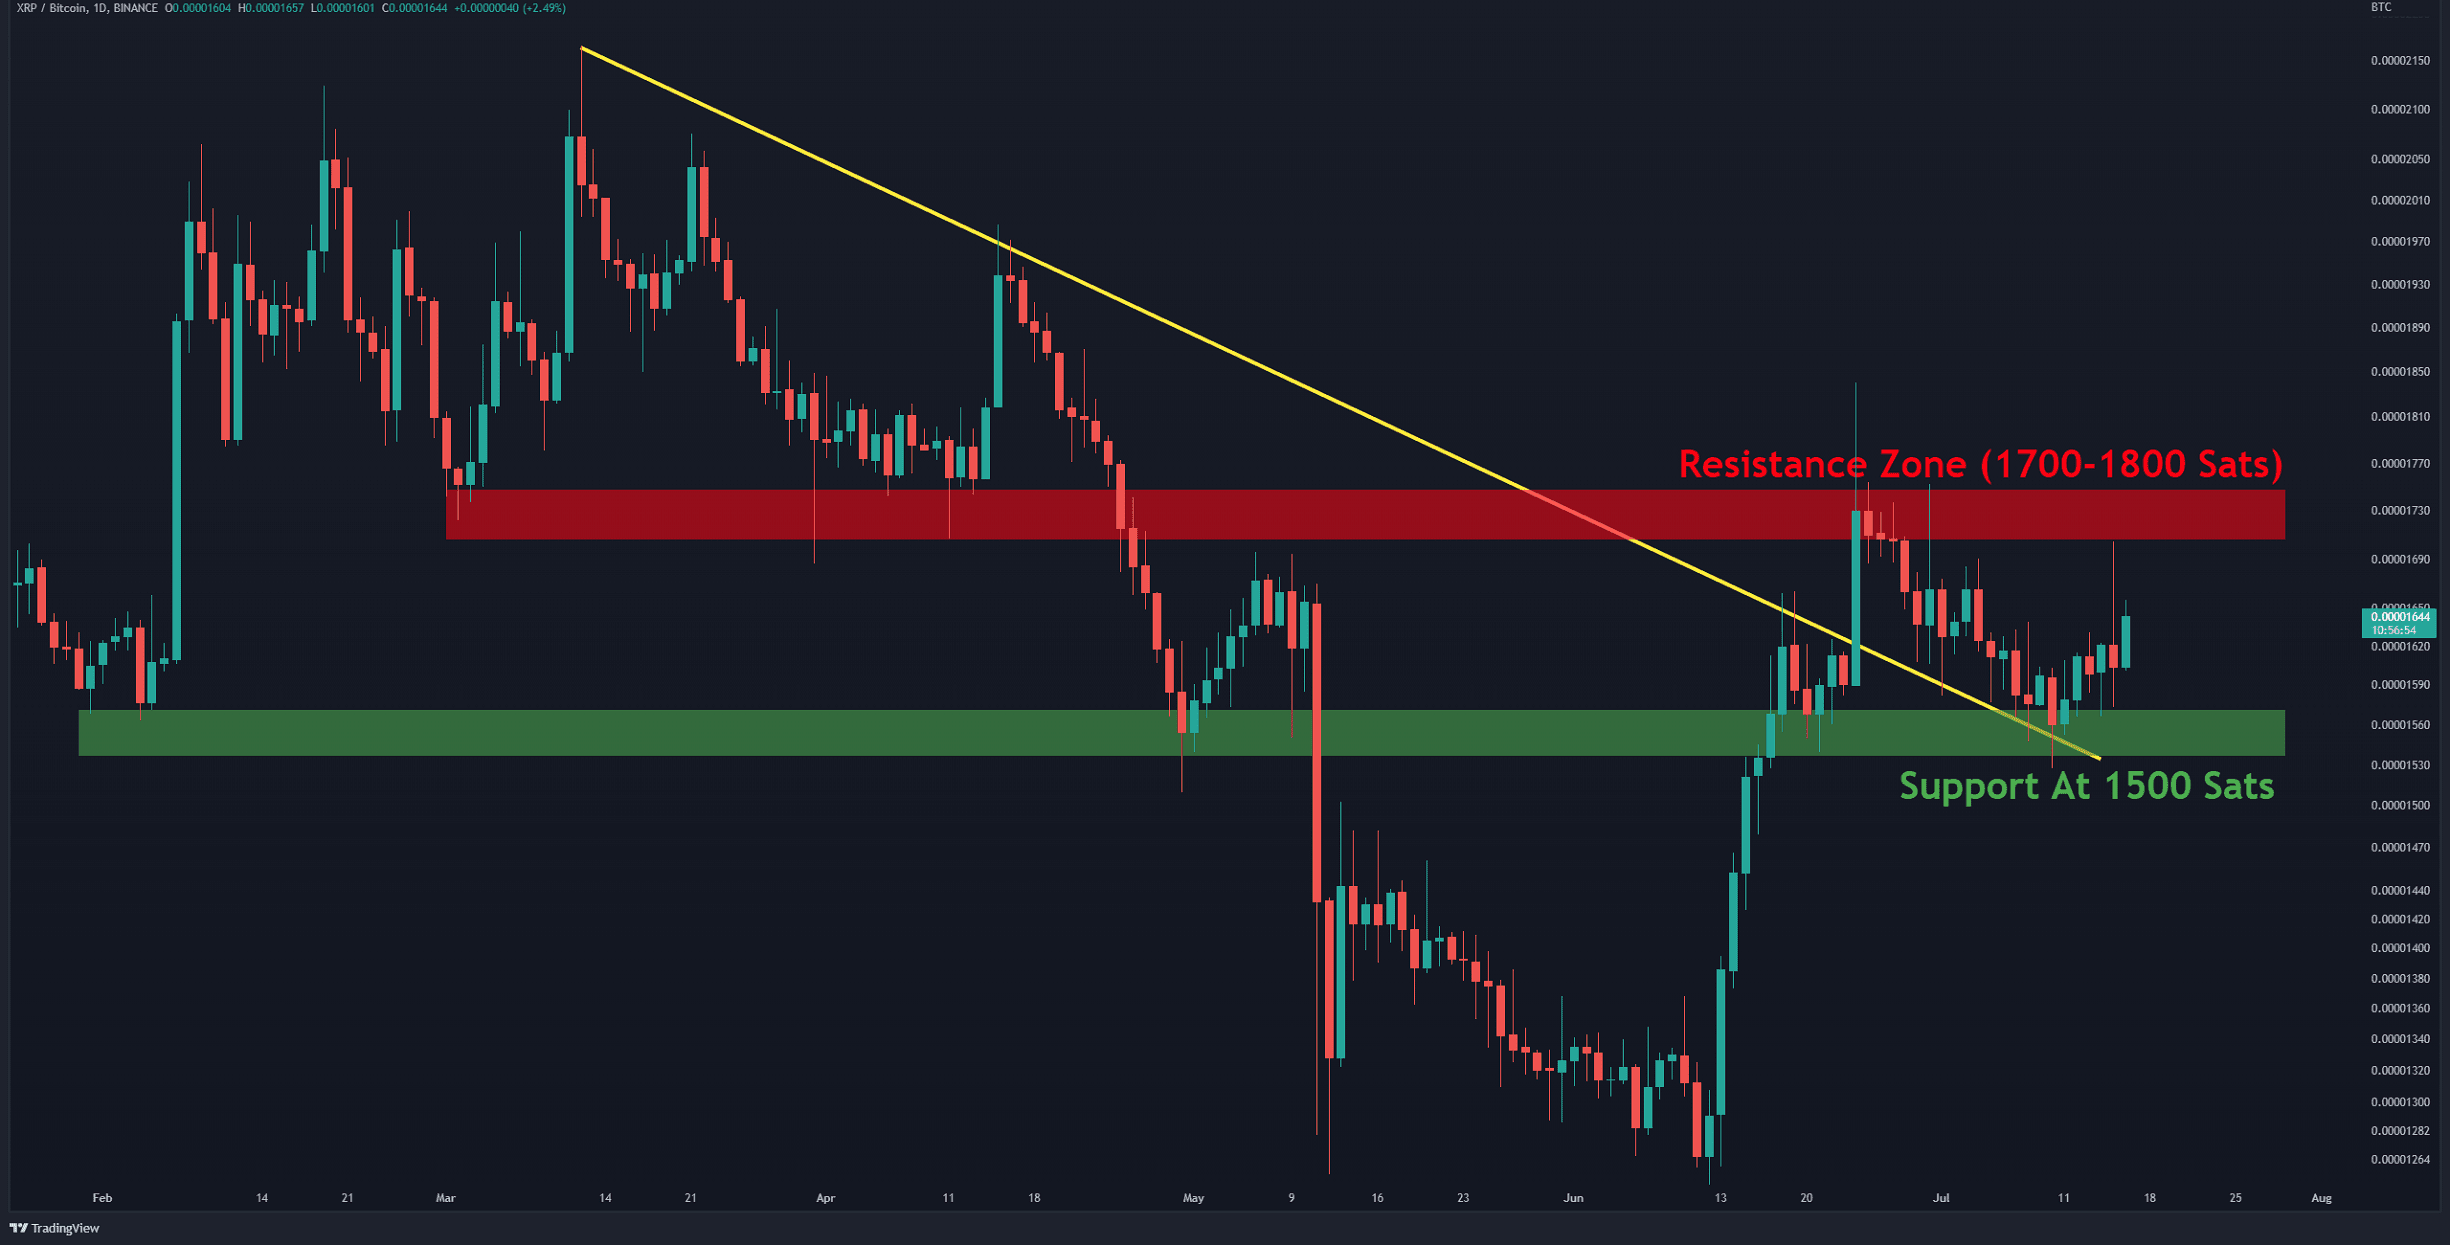
Key Support Levels: 1500 SATs & 1250 SATs
Key Resistance Levels: 1800 SATs & 2000 SATs