

Unlike Bitcoin and many other crypto assets, Ethereum is forming a new low while testing a significant resistance level. ETH should be monitored closely, as the price action in the next few days could provide useful hints for the mid-term market trend.
Technical Analysis
By: Edris
The Daily Chart:
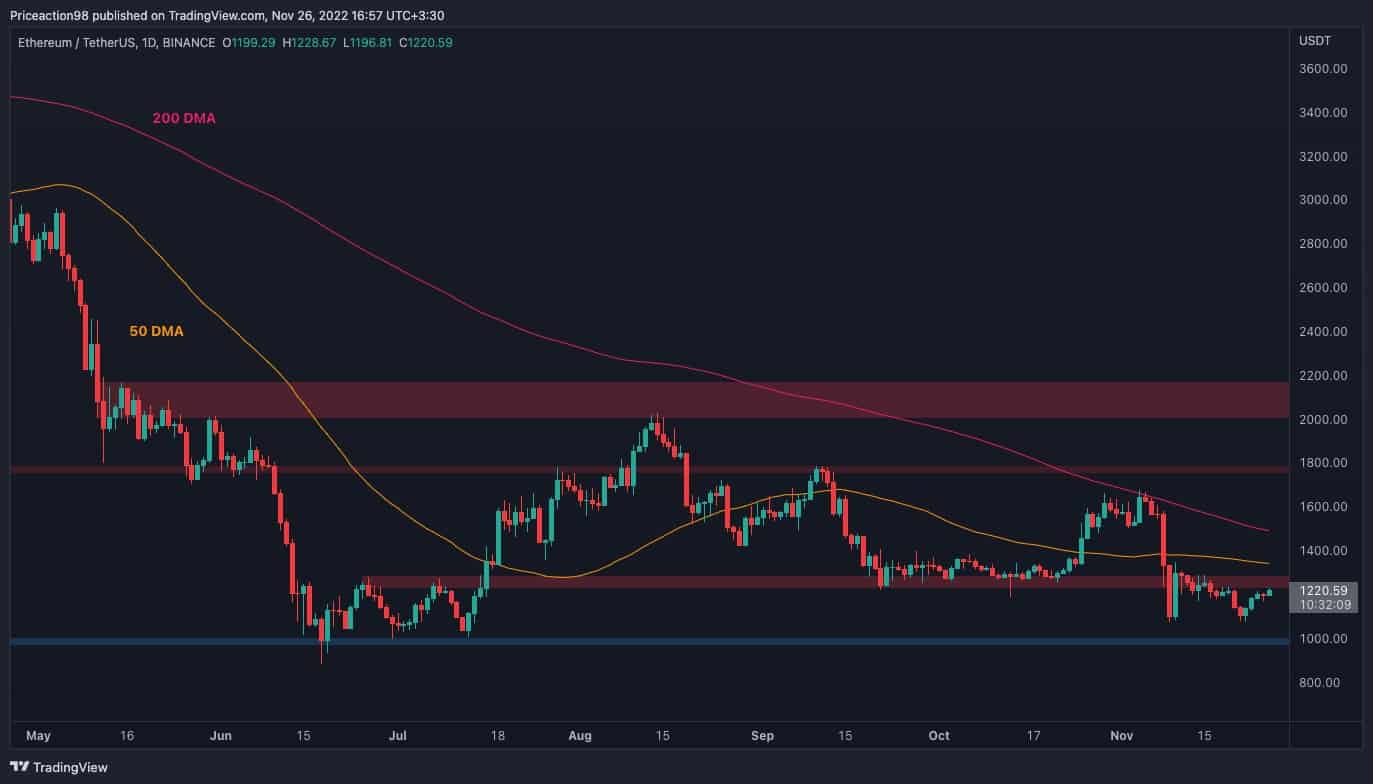
Looking at the daily chart, the price is still trapped between $1250 and $1000 levels but could soon break out. The $1250 resistance level is currently being tested, and if broken to the upside, the 50-day and 200-day moving averages, located around $1300 and $1500 levels, respectively, would be targeted next.
However, as long as the price remains below the 200-day moving average, ETH would technically be considered in a bear market. Therefore any rejection from either of the resistance levels mentioned earlier would be very likely. In this case, the $1000 area could ultimately be tested again, and a breakout below this key level would be interpreted as a very bad sign, as it would lead to another rapid crash.
The 4-Hour Chart:
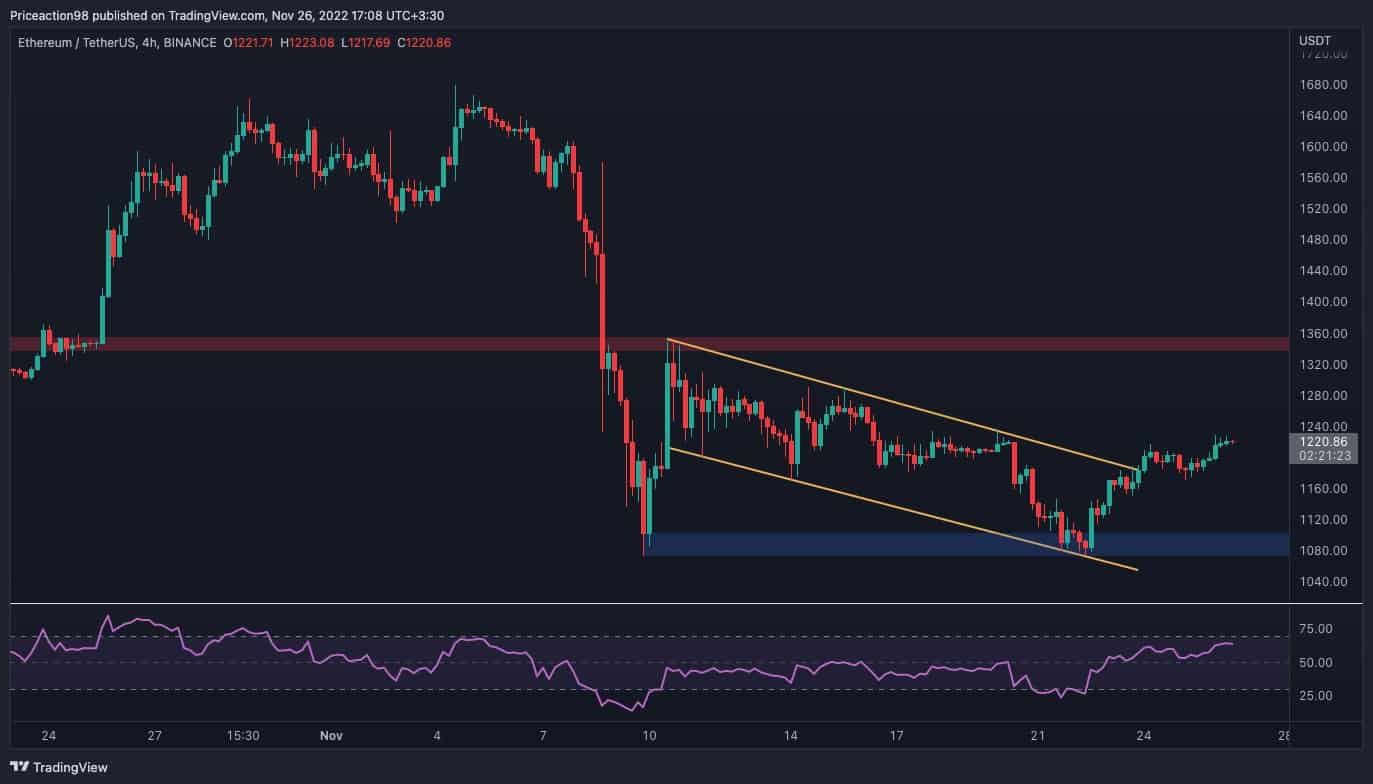
On the 4-hour chart, the price has recently formed a distinctive double bottom pattern around the $1100 support level after ending a bearish flag pattern to the upside. The first target for these patterns is typically the first high of the flag, located near the $1350 mark.
The RSI is, however, approaching overbought values, pointing to a potential pullback or even reversal in the short term. Note that a break back inside the broken flag would cause the bullish scenario to fail, and a decline toward the $1100 level and even lower would be highly probable.
Onchain Analysis
By Shayan
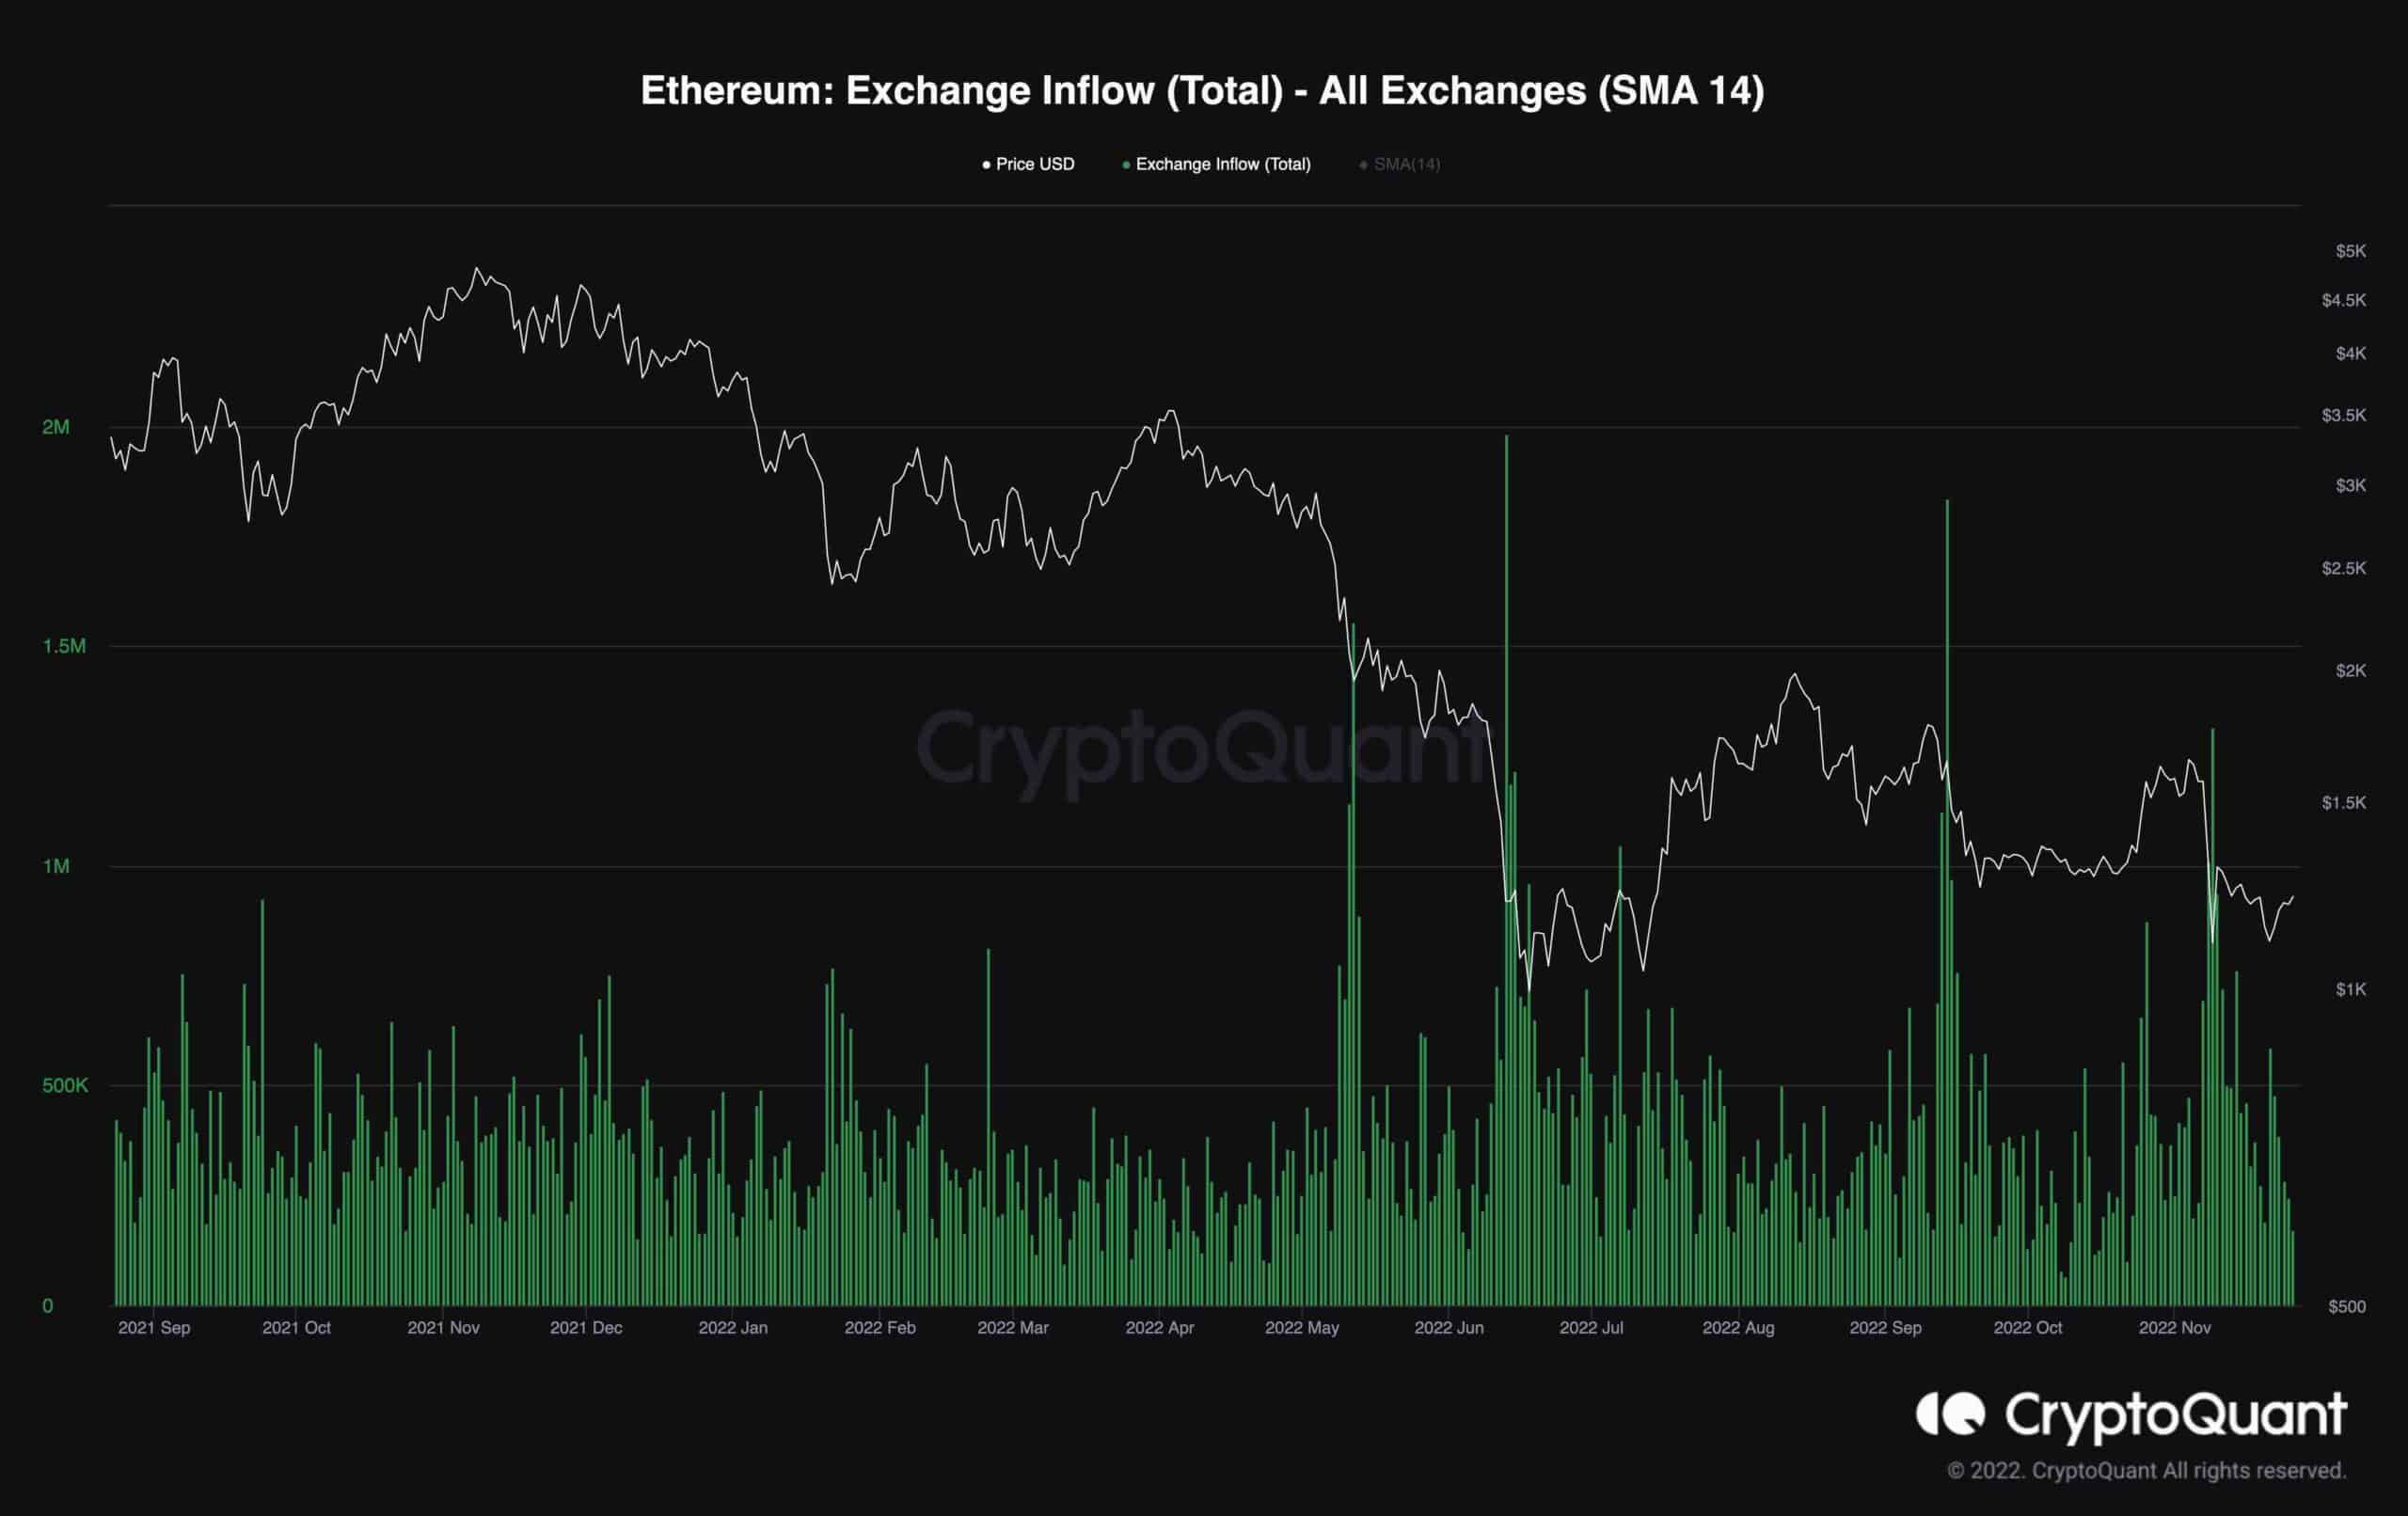
The FTX fallout and the negative sentiment it brought keep dominating the market as the short positions still prevail in the futures market due to the Funding Rates. Meanwhile, ETH deposited into exchanges has spiked in the last few days to more than 100,000 ETH per hour.
The following chart depicts the Exchange Inflow metric. Before each price drop, there was a big jump in the number of transactions into exchanges resulting in more significant selling pressure. This was respectively due to the ongoing financial problems of the FTX exchange as the market participants are experiencing fear and uncertainty and are controlling their exposure by distributing their assets. Nevertheless, the dominance of the short positions might result in a short-squeeze event soon.
The post ETH Paints a Lower Low as a Retest of $1,000 Looking More Likely (Ethereum Price Analysis) appeared first on CryptoPotato.