


Bitcoin is hovering near $81.5K as repeated tests of nearby demand keep buyers under pressure. The broader ascending structure remains intact, but fading rebounds suggest that a stronger response is needed to prevent a deeper correction.
Bitcoin Price Analysis: The Daily Chart
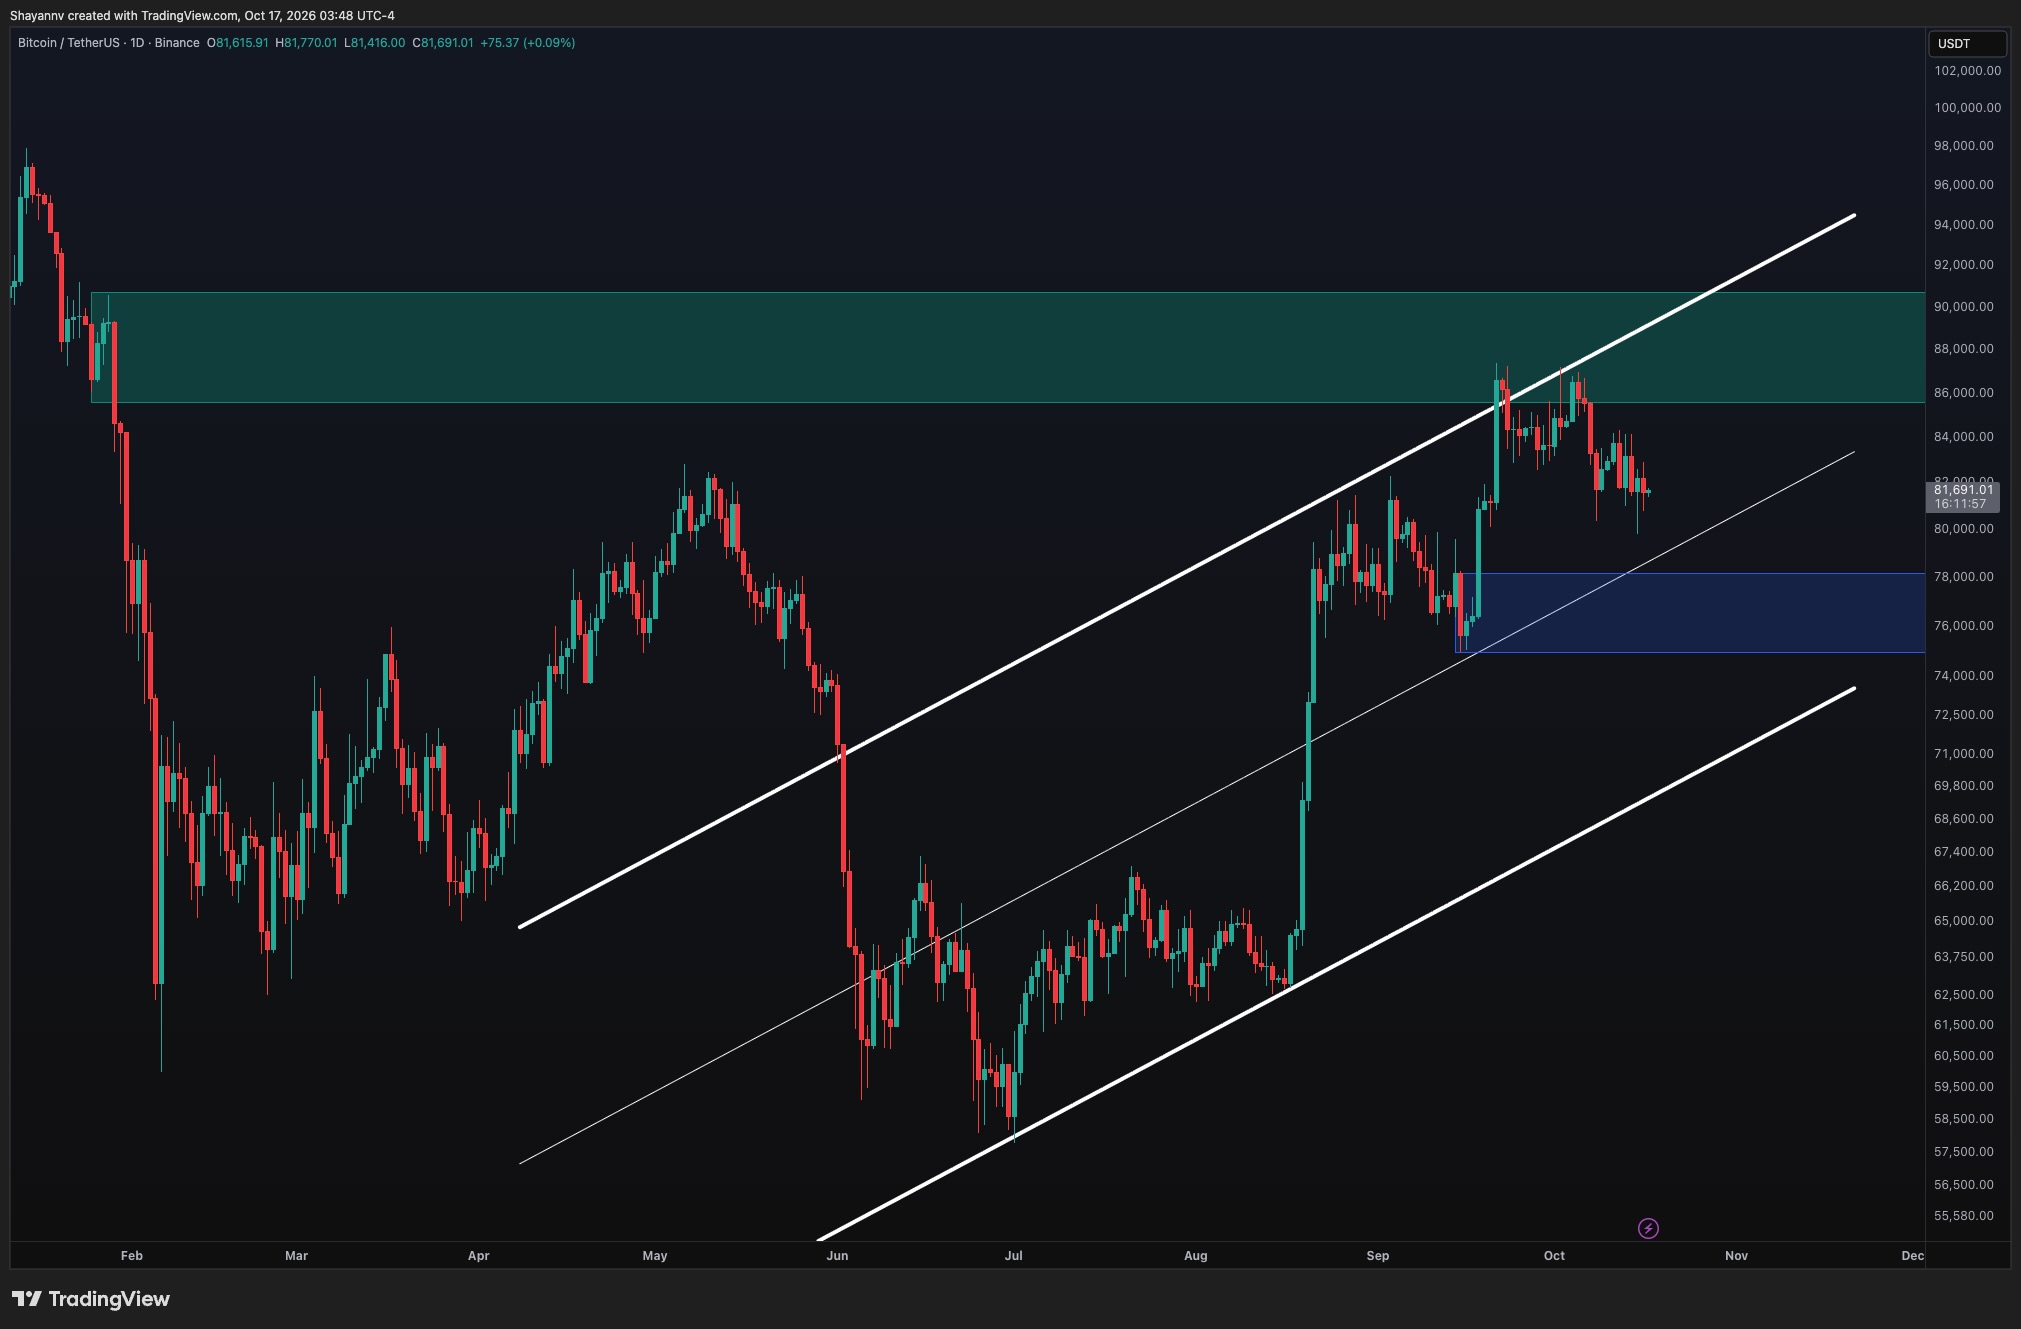
On the daily timeframe, BTC has continued to retreat following its rejection from the $85.5K–$90.5K supply zone. Recent candles show lower highs and repeated probes toward $80K, indicating that buyers have struggled to regain momentum after the initial selloff.
The price is now approaching the ascending channel’s midpoint around $79K–$80K. This trendline represents nearby structural support, while the highlighted $75K–$78K demand zone remains the main daily defense below. Holding these areas would preserve the broader recovery structure, although it would not immediately reverse the recent bearish sequence.
To improve the outlook, Bitcoin needs to reclaim the recent rebound highs around $83K–$84K before challenging the $85.5K–$90.5K resistance zone again. Conversely, sustained weakness beneath $80K would increase the likelihood of a move toward $78K and potentially the lower boundary of demand near $75K.
BTC/USDT 4-Hour Chart
The 4-hour chart places Bitcoin just above the marked buyers’ decision point at $80K–$81.3K. This demand zone overlaps with the rising channel’s lower boundary and has attracted several buying responses. However, successive rebounds have failed to recover the previous highs, leaving the short-term structure vulnerable.
A sustained recovery above $82.5K–$83K would provide an initial sign of improving demand, followed by the recent resistance area around $84K. Beyond that, the sellers’ decision point at $85.5K–$86.7K remains the main barrier. Reclaiming this zone would weaken the corrective scenario and bring the highs near $87K back into focus.
Conversely, a decisive break below the $80K demand boundary and ascending trendline would undermine this support confluence. Such a development could extend the decline toward the next highlighted demand zone around $74.8K–$76.3K. The current area therefore remains pivotal, with buyers needing stronger follow-through to turn repeated defenses into a meaningful recovery.

Sentiment Analysis
The Realized Price UTXO Age Bands chart tracks the average on-chain cost basis of coins grouped by age. Bitcoin, currently near $81.7K, remains above the realized prices of the 1-to-3-month and 3-to-6-month cohorts, positioned around $70.5K and $69.5K, respectively. These younger cohorts remain in aggregate unrealized profit despite the correction.
However, the price remains below the 6-to-12-month cohort’s realized price near $87K and the 18-month-to-2-year cohort’s level around $91K. These cost bases form overhead reference points, with the former overlapping the technical supply zone. Holders approaching breakeven during a rebound could introduce selling pressure, although the metric alone does not confirm that they will sell.
The chart also shows the 1-to-3-month realized price rising while the 3-to-6-month measure declines, bringing both toward the $70K region. This identifies a concentration of younger-holder cost bases well below the current price, rather than immediate support for the present consolidation.
For now, the $87K–$91K cost-basis region remains an important hurdle for a broader recovery. Sustained acceptance above it would return these older cohorts to aggregate unrealized profit, while continued rejection would leave the overhead resistance intact.

The post Bitcoin Price Analysis: Will BTC Lose the $80K Support Next Week? appeared first on CryptoPotato.
