

Ethereum is undergoing a notable correction after an explosive rally that saw its price surge over 85% since late June. After reaching a local high near $3,940, ETH has pulled back approximately 13%, sparking debate among analysts about whether this is a healthy consolidation or a shift in market momentum. While some view the retracement as a natural pause after a rapid uptrend, others caution that selling pressure and macroeconomic uncertainty could trigger deeper downside moves.
Related Reading
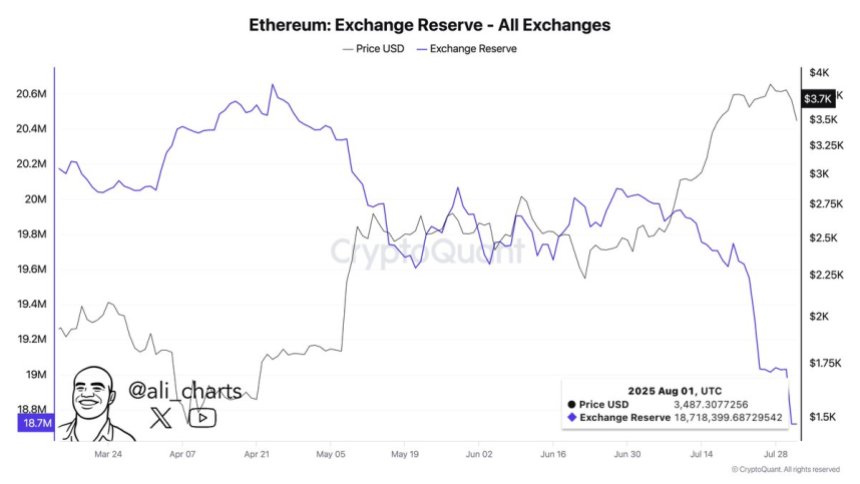
However, on-chain data from CryptoQuant paints a different picture beneath the surface. Despite the recent price drop, a massive amount of Ethereum has been consistently withdrawn from exchanges over the past few weeks. This trend suggests aggressive accumulation by investors moving their holdings into cold storage, reducing the liquid supply on trading platforms.
Such outflows are often interpreted as a bullish signal, indicating that holders are positioning for long-term gains rather than preparing to sell. As Ethereum continues to lead in areas like DeFi, stablecoins, and Real-World Asset (RWA) tokenization, this structural demand could provide a strong foundation for price stability and future rallies.
Ethereum Bullish Accumulation Trend Continues
Analyst Ali Martinez has revealed that over 1 million Ethereum (ETH) have been withdrawn from exchanges in the past two weeks, signaling a strong accumulation trend among investors. This massive outflow reduces the liquid supply of ETH available for trading, which historically correlates with long-term bullish price action. Despite Ethereum facing a 13% correction from its recent high of $3,940, the consistent withdrawal of coins suggests that investors are positioning for the next leg up.
This accumulation trend mirrors the investor behavior seen in Bitcoin over the past year. BTC experienced a similar pattern of exchange outflows throughout 2024, which laid the groundwork for its massive bull cycle. Analysts now believe that Ethereum could follow a comparable trajectory, as the fundamentals supporting ETH remain robust, including its dominance in DeFi, stablecoins, and Real-World Asset (RWA) tokenization.
While the market sentiment remains broadly bullish, some risks persist. Recent US job data released on Friday sparked short-term panic, injecting volatility across crypto and traditional markets. However, many analysts view Ethereum’s current correction as a healthy retracement and an opportunity to accumulate ETH at a discount before the market resumes its upward trend.
Related Reading
ETH Testing Key Support After Sharp Correction
Ethereum (ETH) is currently trading around $3,391 after a sharp correction from its recent high of $3,940. The 12-hour chart reveals that ETH has broken below its short-term support and is now testing the 50-day SMA at $3,462, which could act as a near-term support level. If bulls fail to defend this zone, the next critical support is located around $2,852, a key level that previously acted as strong resistance in late June.
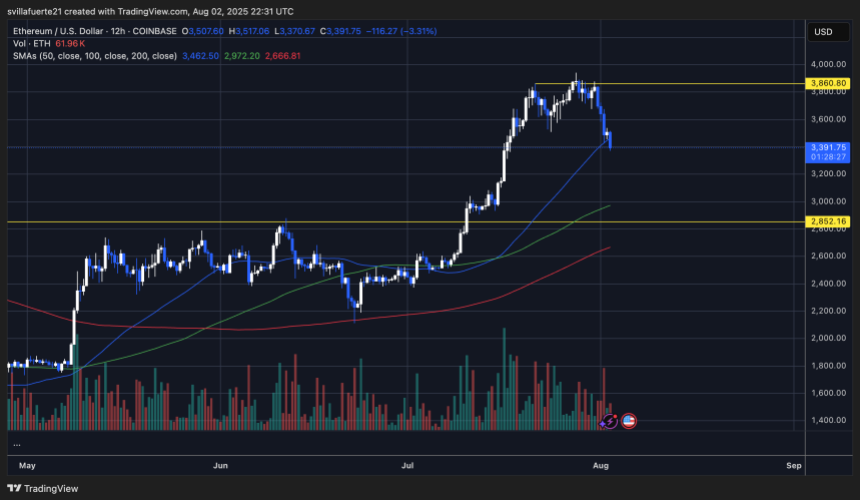
Volume spikes during the breakdown suggest increased selling pressure, which aligns with recent profit-taking activities by short-term holders. However, despite this drop, Ethereum’s price structure remains in an overall uptrend, with higher highs and higher lows intact on the broader timeframe.
Related Reading
The correction appears to be a retest of previous breakout levels, as ETH had surged over 85% since late June. Maintaining the $3,350-$3,450 range is crucial for bulls to regain control and attempt another move toward the $3,860 resistance zone. Failure to hold could trigger a deeper correction towards the 100-day SMA at $2,972.
Featured image from Dall-E, chart from TradingView