

Key Support levels: $3,000, $2,750
Key Resistance levels: $3,600, $4,000
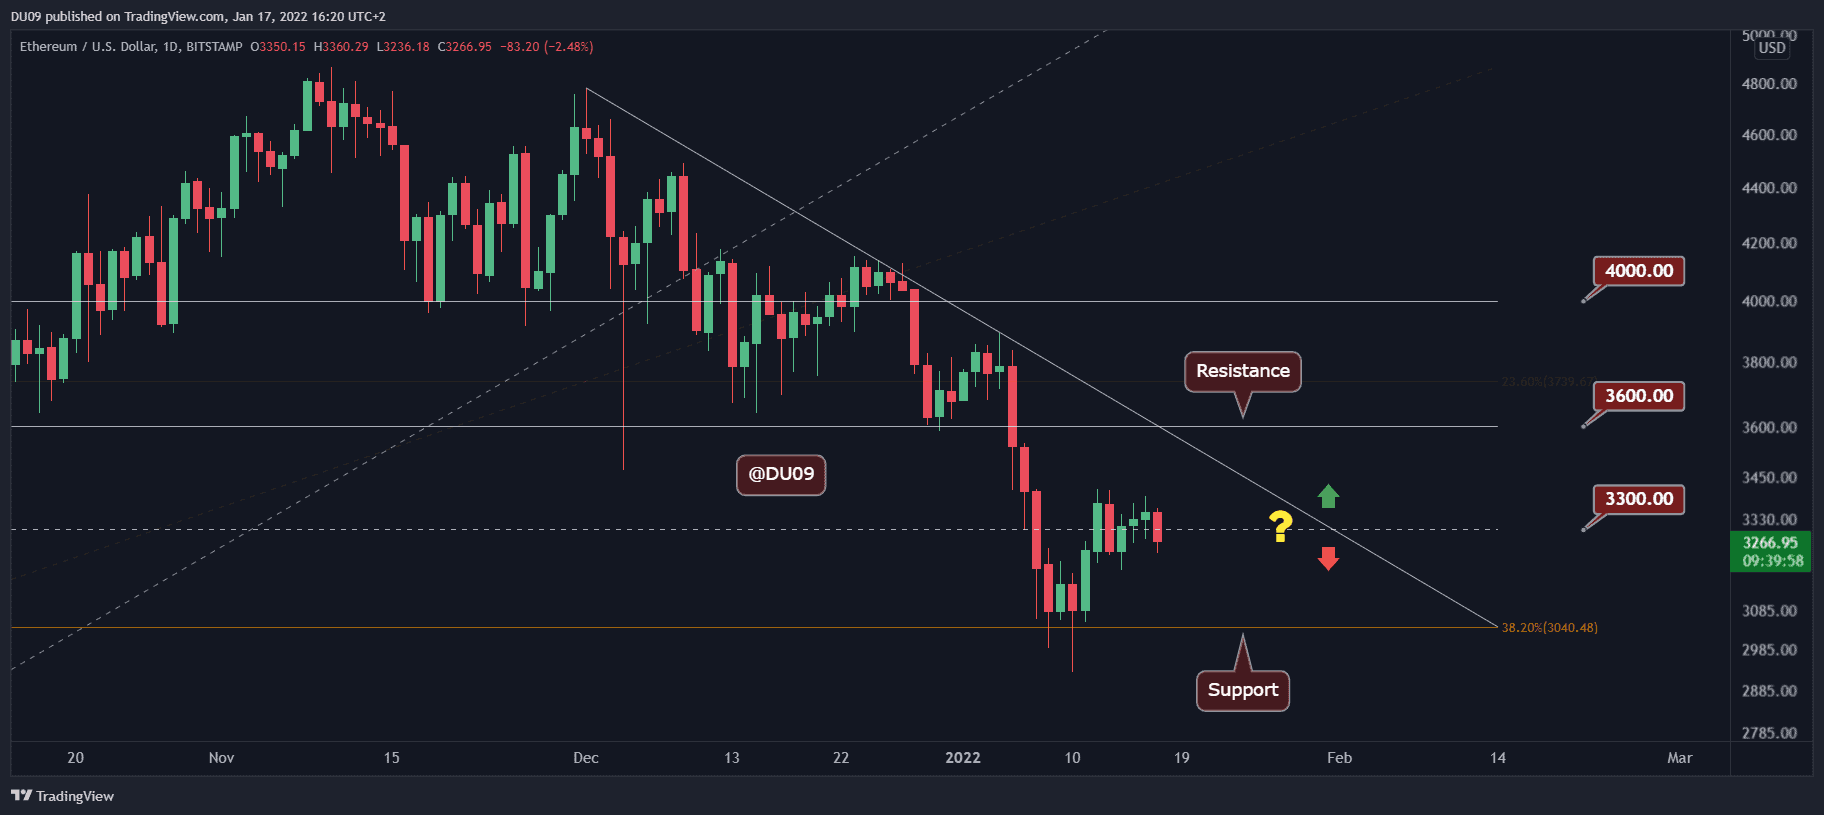
ETH has been in a flat trend around the $3,300 level for some time now, unable to rally or go much lower. A strange equilibrium between market forces has kept the cryptocurrency at this level for the past week. The support at $3,000 has not been retested, nor was the resistance at $3,600 put under any pressure. The result is a sideways price action that shows indecision.
Technical Indicators
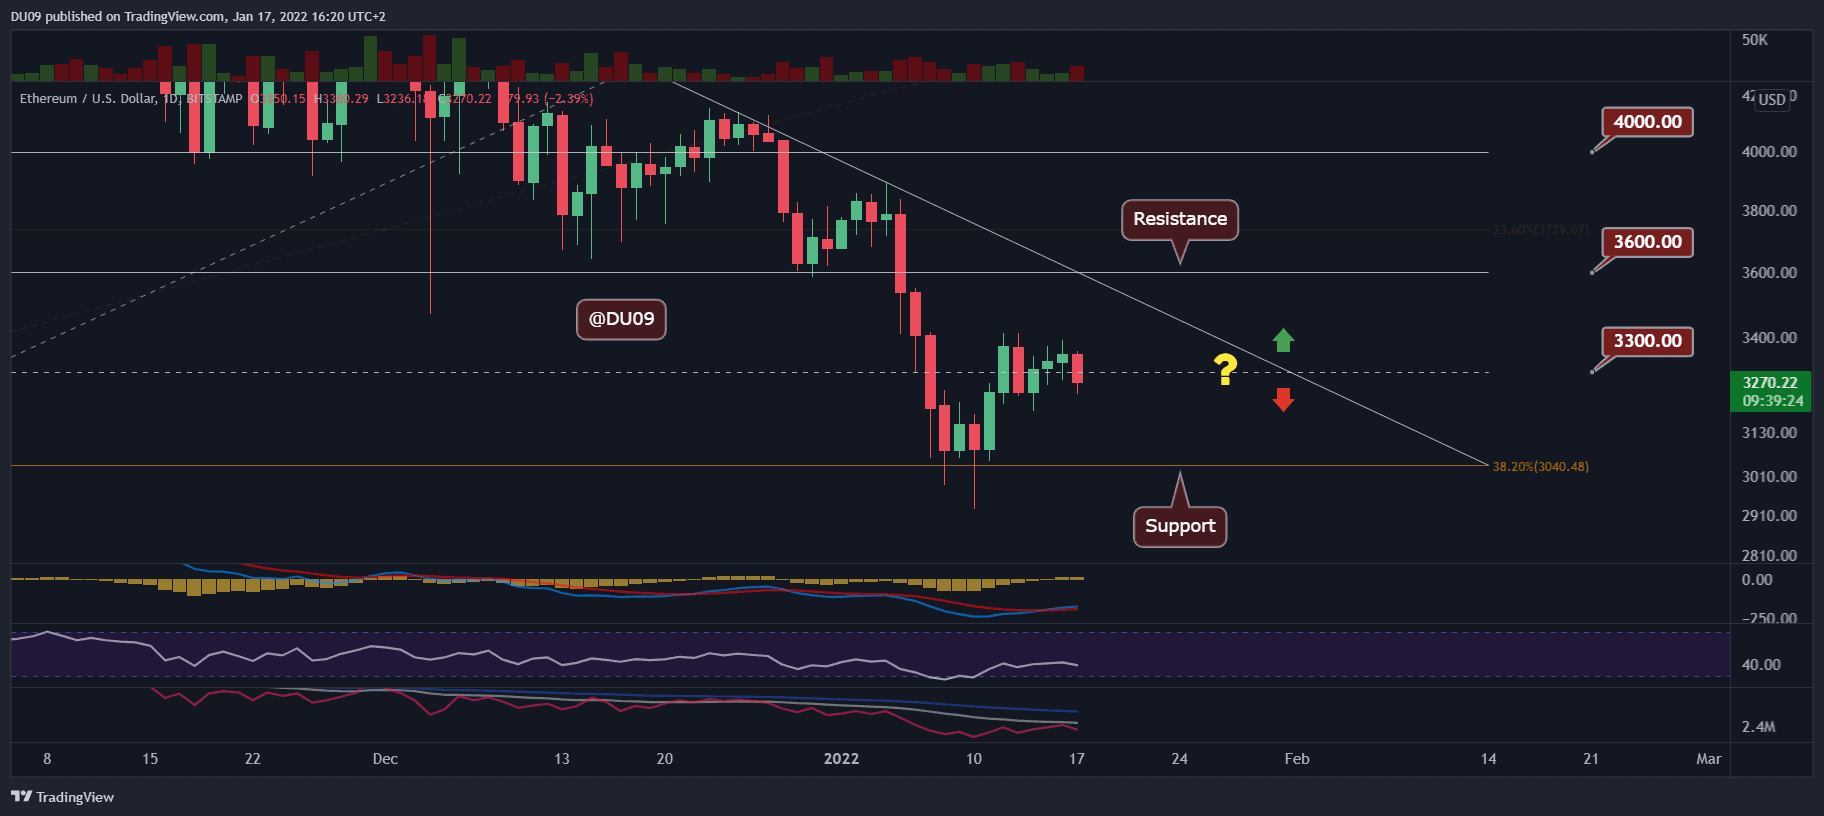
Trading Volume: The volume increased today, but this time, the bears had the upper hand pushing the price below $3,300. However, they were unable to sustain any further declines.
RSI: The daily RSI failed to make a higher high, and this most recent drop favors the bearish case. If buyers don’t step up, ETH could fall back to the key support.
MACD: The daily MACD is bullish but lacked the momentum to push prices higher. If this continues, then bears may take over.
Bias
The bias for ETH is neutral. Neither the buyers nor the sellers seem convinced to move from the current level.
Short-Term Price Prediction for ETH
ETH has consolidated around $3,300 for the past week with little volatility. If history is any indication, flat trends tend to end in vicious moves in either direction.