


Ethereum’s prolonged consolidation beneath resistance has pushed the asset lower, sending it toward $2.42K. The breakdown has weakened short-term structure, while the broader recovery now depends on buyers defending the support areas below.
Ethereum Price Analysis: The Daily Chart
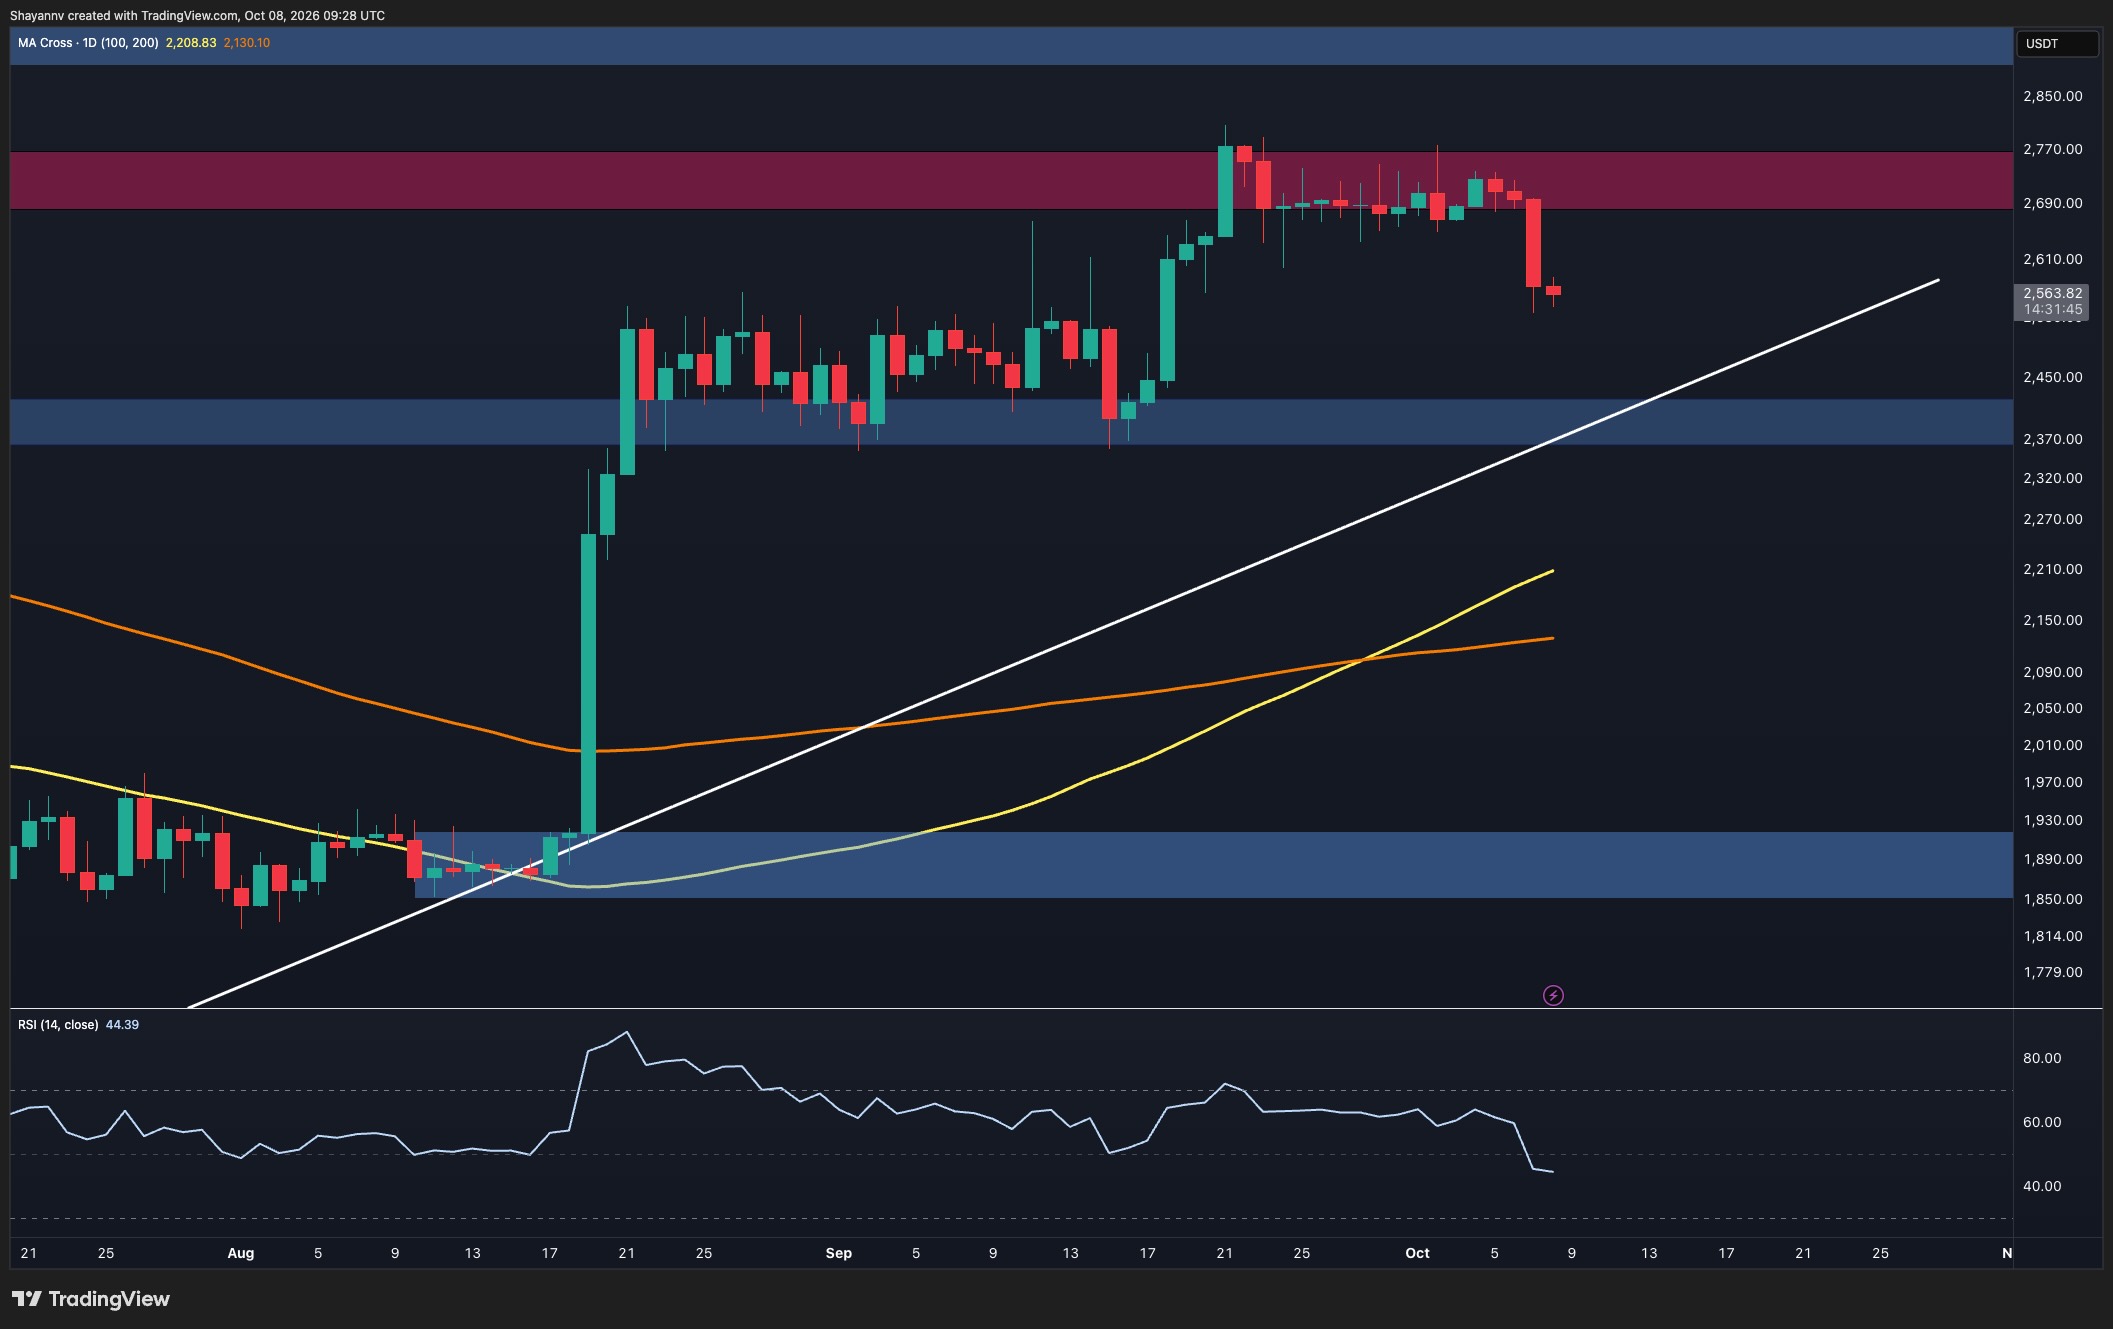
On the daily timeframe, Ethereum has fallen sharply after repeatedly failing to clear the $2.68K–$2.77K resistance zone. The large bearish candle marks a departure from the recent consolidation, suggesting that sellers have gained control of the immediate price action.
Momentum has also deteriorated, with the daily RSI dropping to approximately 44 and moving below neutral. Nevertheless, Ethereum remains above both major moving averages. The 100-day average, near $2.21K, has already crossed above the 200-day average around $2.13K, preserving a constructive longer-term backdrop despite the current correction.
The highlighted $2.36K–$2.42K demand zone is the next major daily support area. The ascending trendline approaches this region, creating a potential confluence where buyers may attempt to stabilize the price.
Holding this area would keep the broader recovery structure intact, while a sustained breakdown would expose the moving-average region around $2.13K–$2.21K. On the upside, reclaiming the $2.68K–$2.77K supply zone remains necessary to restore a stronger bullish outlook.
ETH/USDT 4-Hour Chart
The 4-hour chart shows a decisive bearish break from a symmetrical triangle. After compressing between descending resistance and ascending support, Ethereum fell beneath the lower boundary near $2.68K and extended its decline toward $2.42K. The limited rebound following the selloff suggests that buyers have yet to establish a convincing recovery.
The RSI is now around 26, placing short-term momentum in oversold territory. This could support a temporary relief bounce, although oversold conditions alone do not confirm a reversal. Any recovery would initially face resistance around $2.6K–$2.62K, followed by the broken triangle boundary and supply zone near $2.68K–$2.7K.
As selling pressure persisted, the highlighted $2.40K–$2.42K demand zone became the next important support area. Failure to defend it would increase the risk of a move toward the September lows around $2.36K–$2.38K. Conversely, sustained acceptance back above the triangle’s former support would weaken the bearish breakdown scenario and allow another challenge of $2.77K.

Sentiment Analysis
The two-week Binance ETH/USDT liquidation heatmap shows that the latest decline has moved through the previously dense estimated liquidation bands around $2.6K–$2.65K. These bands fade behind the falling price, consistent with leveraged positions being cleared as Ethereum moved lower, although the heatmap does not quantify actual executed liquidations.
With Ethereum now near $2.56K, the remaining nearby downside concentrations appear around $2.52K–$2.54K, with additional bands toward $2.48K–$2.5K. These areas could become relevant if the correction continues, particularly as the lower clusters approach the technical demand zone.
Above price, a nearby band remains around $2.63K–$2.64K, while the most prominent overhead concentration sits around $2.78K–$2.84K. A sustained recovery could bring these pools into focus, but the current technical breakdown favors caution until Ethereum reclaims its lost support. The liquidation distribution highlights potential areas of accelerated volatility rather than guaranteeing the next direction.

The post Ethereum Price Analysis: ETH Crashes 10% Weekly – How Low Can It Go? appeared first on CryptoPotato.
