


Ethereum is navigating renewed volatility after weeks of relentless gains and bullish momentum. The world’s second-largest cryptocurrency surged to its highest levels in years, but bulls are now locked in a battle to defend the $4,200 mark. This price point has emerged as a crucial short-term support, with institutional buyers continuing to accumulate ETH despite recent turbulence in broader markets.
What stands out in this phase is Ethereum’s exchange inflow activity compared to Bitcoin. Over the past month, the two assets have displayed sharply different patterns. While Bitcoin’s inflows have remained relatively moderate, signaling stability and limited selling pressure, Ethereum has seen a significant uptick in coins moving onto exchanges.
This divergence suggests a more dynamic market structure for Ethereum. Rising inflows could indicate profit-taking by long-term holders, or repositioning by large investors preparing for volatility or upcoming catalysts in the ETH ecosystem. Still, institutional interest, alongside strengthening fundamentals such as declining supply on exchanges, continues to support Ethereum’s long-term outlook. Traders now watch closely to see if ETH can hold $4,200 and stabilize for another leg higher.
Bitcoin vs. Ethereum: Divergence in Exchange Inflows
According to on-chain data from CryptoQuant, Bitcoin (BTC) and Ethereum (ETH) are showing a clear divergence in exchange inflows, signaling very different dynamics at play in the market. Bitcoin inflows have remained moderate, fluctuating between 12,000 and 70,000 BTC per day.
While there have been brief spikes in mid-July and around August 1st, these movements have not persisted long enough to suggest a broader trend. This steadiness implies that BTC holders are not rushing to exchanges, which reduces immediate selling pressure. It also reinforces the idea that sentiment around Bitcoin remains relatively stable despite recent volatility in price action.
Ethereum, however, is telling a different story. Over the past several weeks, ETH inflows have surged significantly, with daily exchange inflows repeatedly climbing above 2 million ETH in mid-August and peaking near 2.6 million ETH. This marks a sharp increase compared to late July, when inflows often sat below 1.5 million ETH.

Such elevated activity suggests large-scale repositioning among major holders or increased profit-taking following ETH’s strong rally. The data highlights that Ethereum is entering a more active trading phase, potentially introducing short-term selling pressure that could influence price direction.
The divergence is striking: Bitcoin inflows suggest relative calm, while Ethereum inflows signal heightened market activity. This imbalance means traders should watch ETH closely, as sustained exchange inflows could either spark a corrective pullback or serve as a stepping stone for a renewed rally, depending on how the market digests the additional liquidity.
Technical Details: Key Price Levels
Ethereum’s recent price action shows a notable retracement following weeks of strong bullish momentum. After peaking near $4,790, ETH has pulled back to around $4,272, reflecting an 11% decline. This move has brought the price back toward a critical support zone at $4,200, where bulls are currently attempting to defend against further downside pressure.
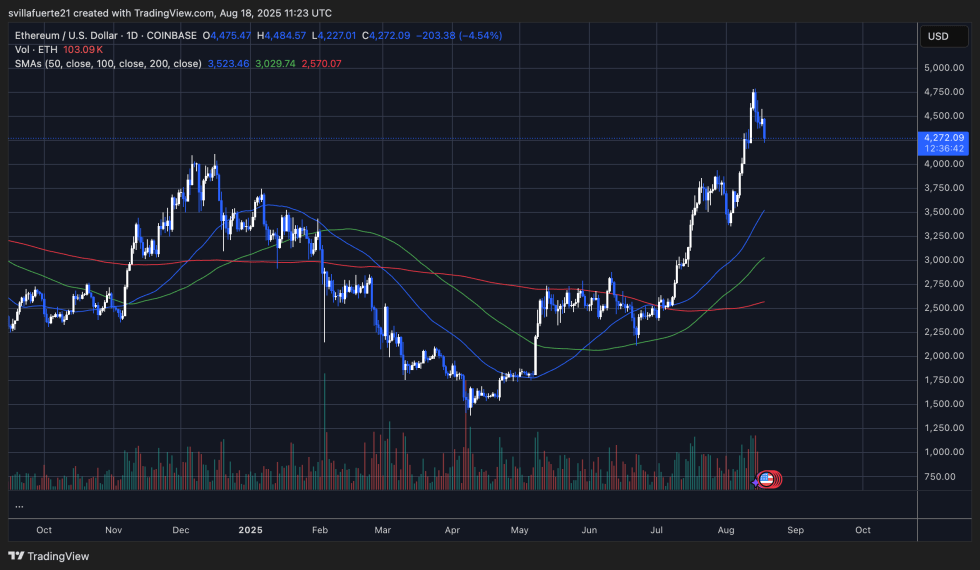
The chart highlights that Ethereum remains well above its key moving averages (50, 100, and 200-day), which are all trending upward and reinforcing a broader bullish structure. Despite the sharp retracement, the longer-term trend still favors buyers, as ETH has maintained higher highs and higher lows since its reversal earlier this year.
A breakdown below $4,200 zone could open the door to $3,800–$3,900, while a successful defense could set the stage for another attempt at the $4,800–$5,000 region. Overall, Ethereum’s chart continues to show bullish strength, though volatility remains high.
Featured image from Dall-E, chart from TradingView
Editorial Process for bitcoinist is centered on delivering thoroughly researched, accurate, and unbiased content. We uphold strict sourcing standards, and each page undergoes diligent review by our team of top technology experts and seasoned editors. This process ensures the integrity, relevance, and value of our content for our readers.